Signal Processing
Scilab provides tools to visualize, analyze and filter signals in time and frequency domains.
Sampling
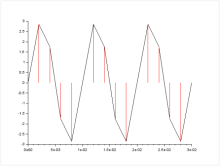 Here is the example of a bad sampling of a sine signal:
nb_pts=16; step=2e-3; t=step*(0:1:nb_pts-1);
amp=3;f=100; s=amp*sin(2*%pi*f*t);
plot2d(t,s); plot2d3(t,s,style=color('red'))
Fourier Transform
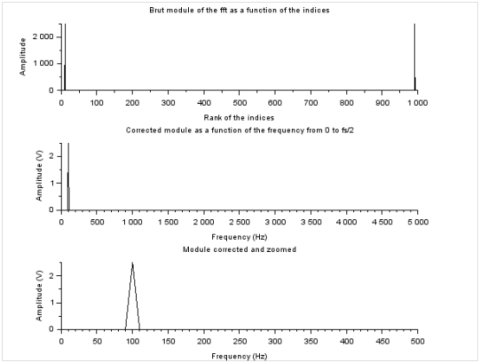
N=1000 ; Ts=0.1e-3 ; F=100 ; t=Ts*(0:N-1); s=5*sin(2*%pi*F*t); f=1/(N*Ts)*( 0 : N-1) ;

sf=fft(s) ;
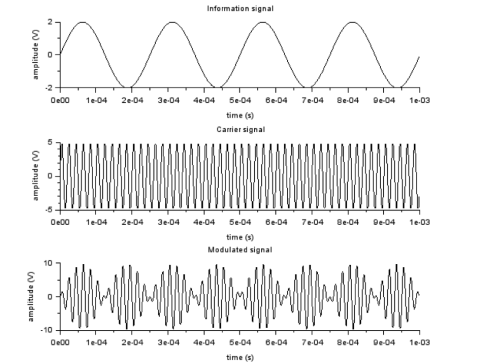
Signal Modulation
Further features:
- Data windowing
- Power spectral density estimation
- Digital FIR and IIR filter design
- Analog filter design
- Signal transforms including fftw
Online Help chapter
See also:
- Scilab Functions
- Available external modules
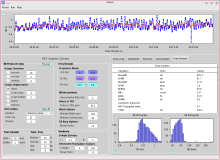
Signal processing applications
Cardiovascular wave analysis
Speech analysis