Data visualization
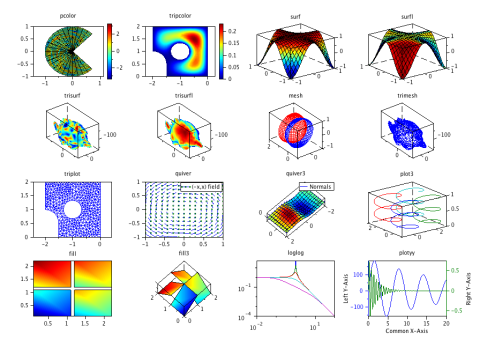
Scilab provides graphics functions to visualize, annotate and export data and offers many ways to create and customize various types of plots and charts:
- Lines
- Pie charts
- Histograms
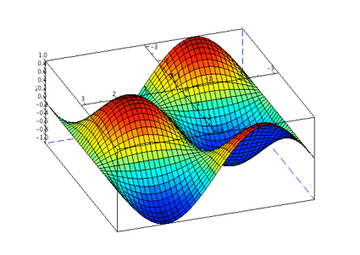
- Surfaces
- LaTeX / MathML annotations
- Graphics export in many formats: PNG, PPM, EMF, EPS, PDF, SVG, ...
Animations
Additional graphic capabilities:
Plotlib ATOMS module of Stéphane Mottelet
See also: