Monte-Carlo Simulation of Weather data
This tutorial was kindly contributed by Heinz Nabielek.
“Scilab has often help me with easy and fast Monte-Carlo Simulations. It also stands for a lot of different programming languages, but Scilab make it effortless and transparent. Here is an example of wind speed analysis.
I took 200 days of windspeed records in Rotterdam and Vienna and extrapolated it on a typical high of 150 m of a wind mill. The cumulativ frequency distribution of the wind speed results from the Weibull distribution:
![]()
with v for the speed and vchar for the characteristic speed
For Rotterdam, vchar ~=10.7 ms-1 and for Vienna vchar ~=8.5 ms-1 .
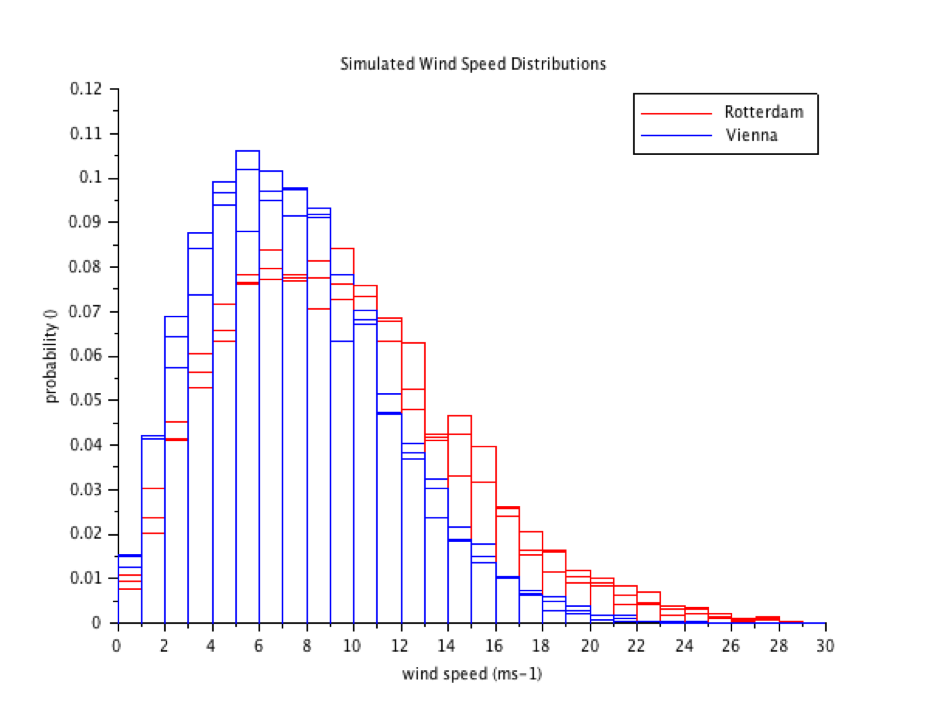
Monte Carlo simulations of these both distributions are rapidly processed and represented. The grand function does not present a Weibull distribution, but it is easy to implement by ourselves:
RTM=10.67229219; VIE=8.542709123;
histplot(0:30, RTM*sqrt(–log(1–grand(1,3000,‘def’))),style=5);
histplot(0:30, VIE*sqrt(–log(1–grand(1,3000,‘def’))),style=2);
xtitle(“Simulated Wind Speed Distributions”,“wind speed (ms-1)”,“probability ()”);
legend(“Rotterdam”, “Vienna”);
The concrete problem is the distribution of the maxima, when N samples of the Weibull distribution are withdrawn. For example, the question of the frequency distribution of the strongest wind speed in one month. The mathematicians did not find an analytical soluton for the distribution of the maxima of Weibull and I solved the problem with a Scilab simulation.
For the windspeed in Rotterdam,the maxima look like this, and it means that the wind mills often have to be shut down because v>25 ms-1:
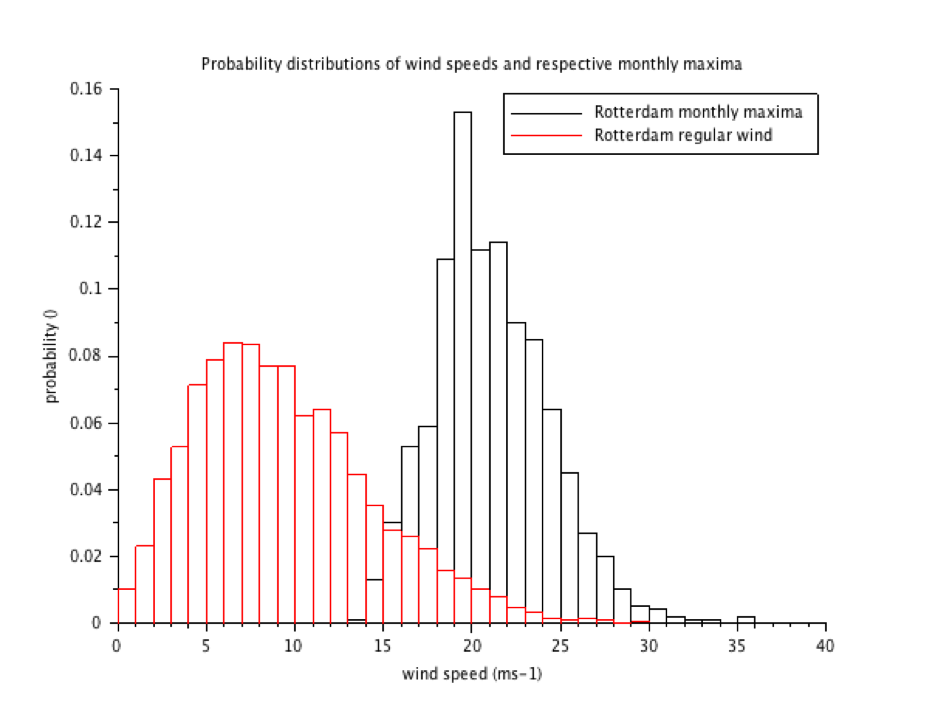
clf; a=[];
for i=1:1000
a=[a RTM*max(sqrt(-log(1-grand(1,30,’def’))))];
end
histplot(0:40, a);
histplot(0:30, RTM*sqrt(-log(1-grand(1,3000,’def’))),style=5);
legend(“Rotterdam monthly maxima”, “Rotterdam regular wind”);
xtitle(“Probability distributions of wind speeds and respective monthly maxima”,”wind speed (ms-1)”,”probability ()”);
For the wind speed in Vienna, the maxima look like this, and Scilab shows that the monthly maxima are rarely over 25:
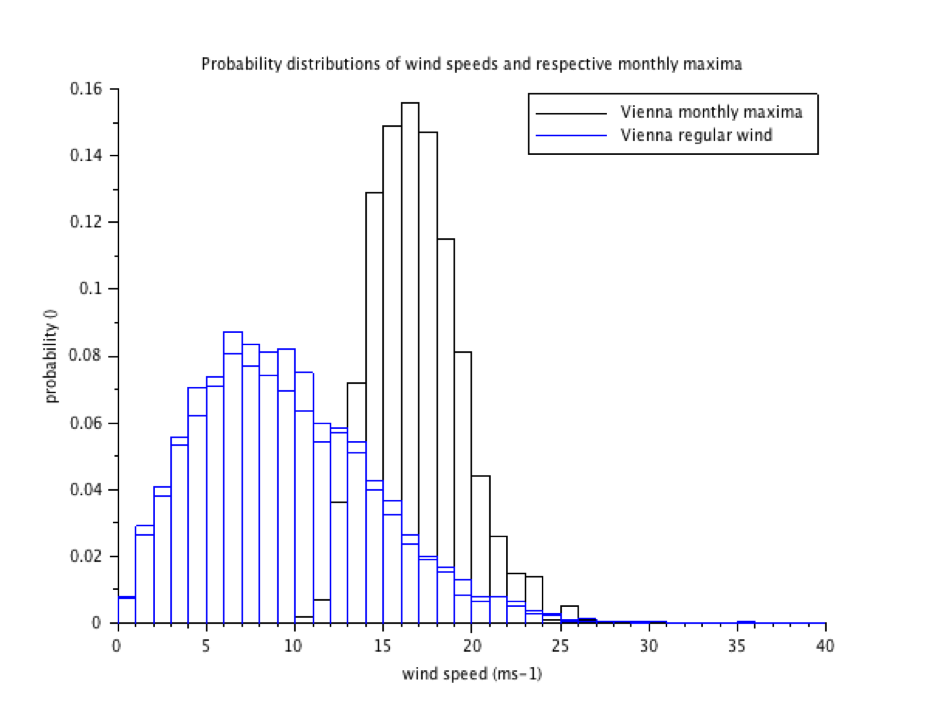
clf; a=[];
for i=1:1000
   a=[a VIE*max(sqrt(–log(1–grand(1,30,‘def’))))];
end
histplot(0:40, a);
histplot(0:40, RTM*sqrt(–log(1–grand(1,3000,‘def’))),style=2);
xtitle(“Probability distributions of wind speeds and respective monthly maxima”,“wind speed (ms-1)”,“probability ()”);
legend(“Vienna monthly maxima”, “Vienna regular wind”);
The meteorologists use the Gumbel function for the maxima of the windspeed upon the recommendation of the mathematicians. But it isn’t correct as the Monte Carlo simulation suggests.”