How to develop an application in Scilab
Welcome to Scilab! Here is a first view of your development environment.
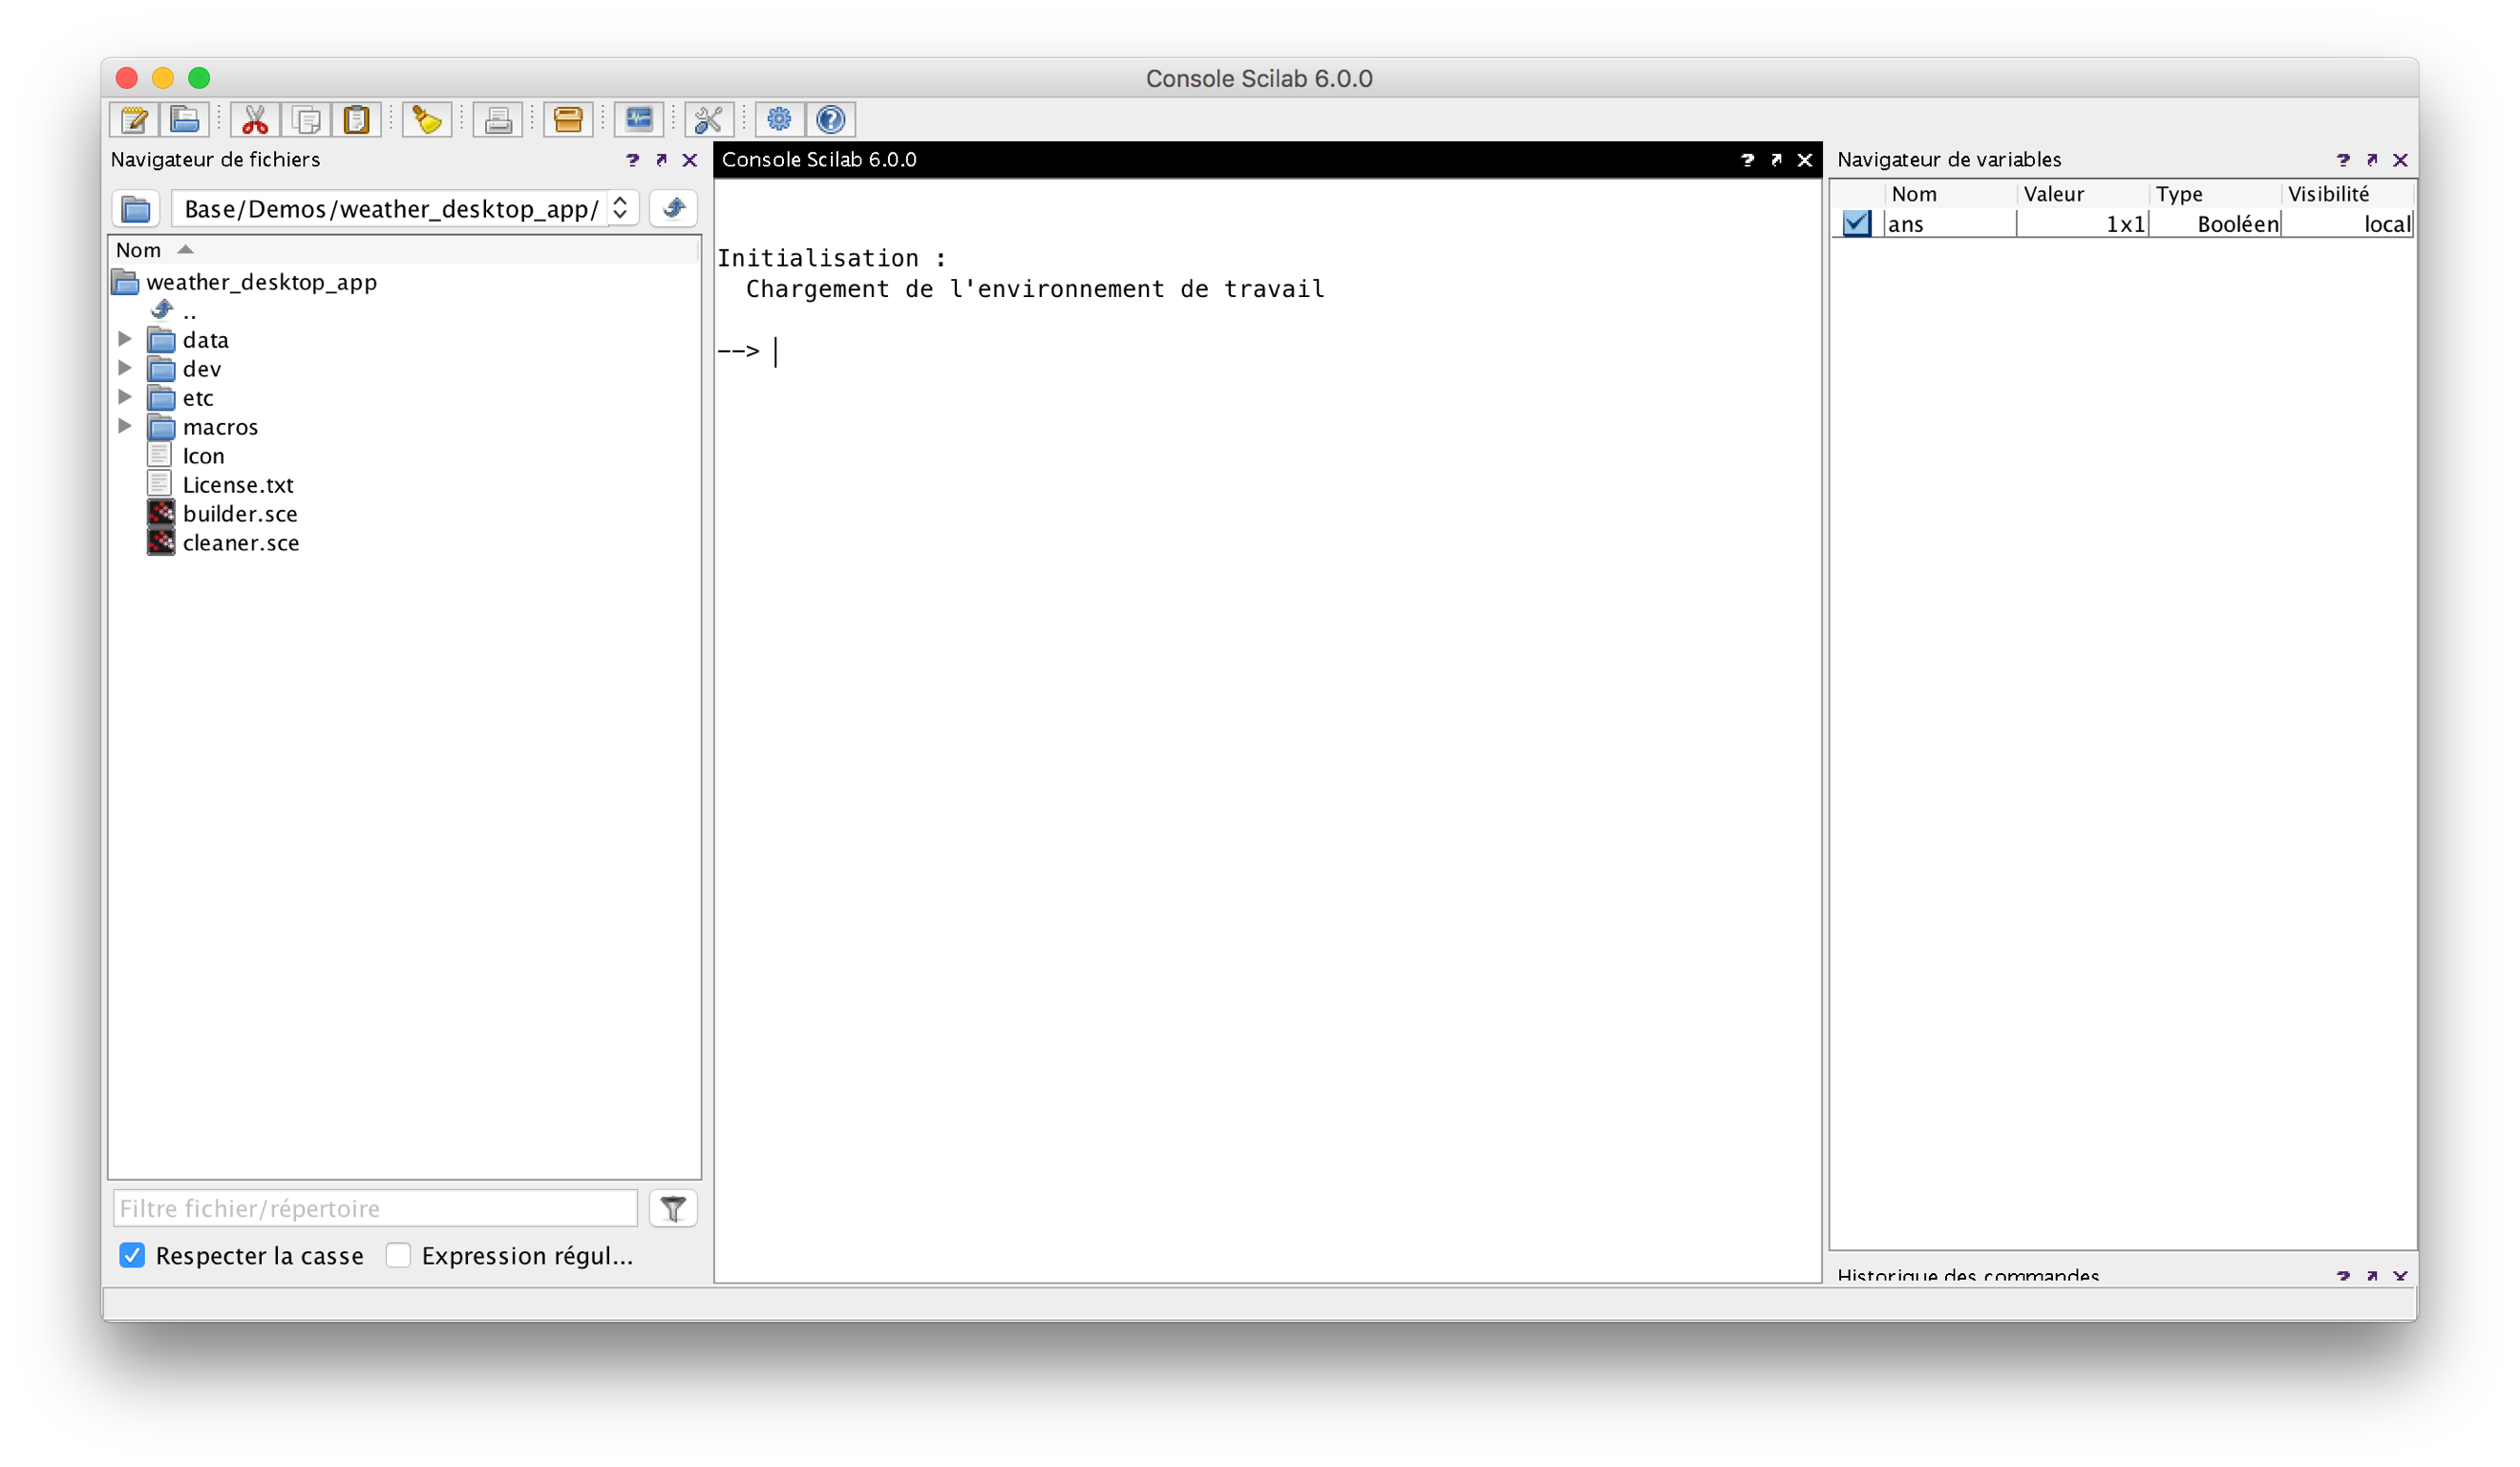
File browser
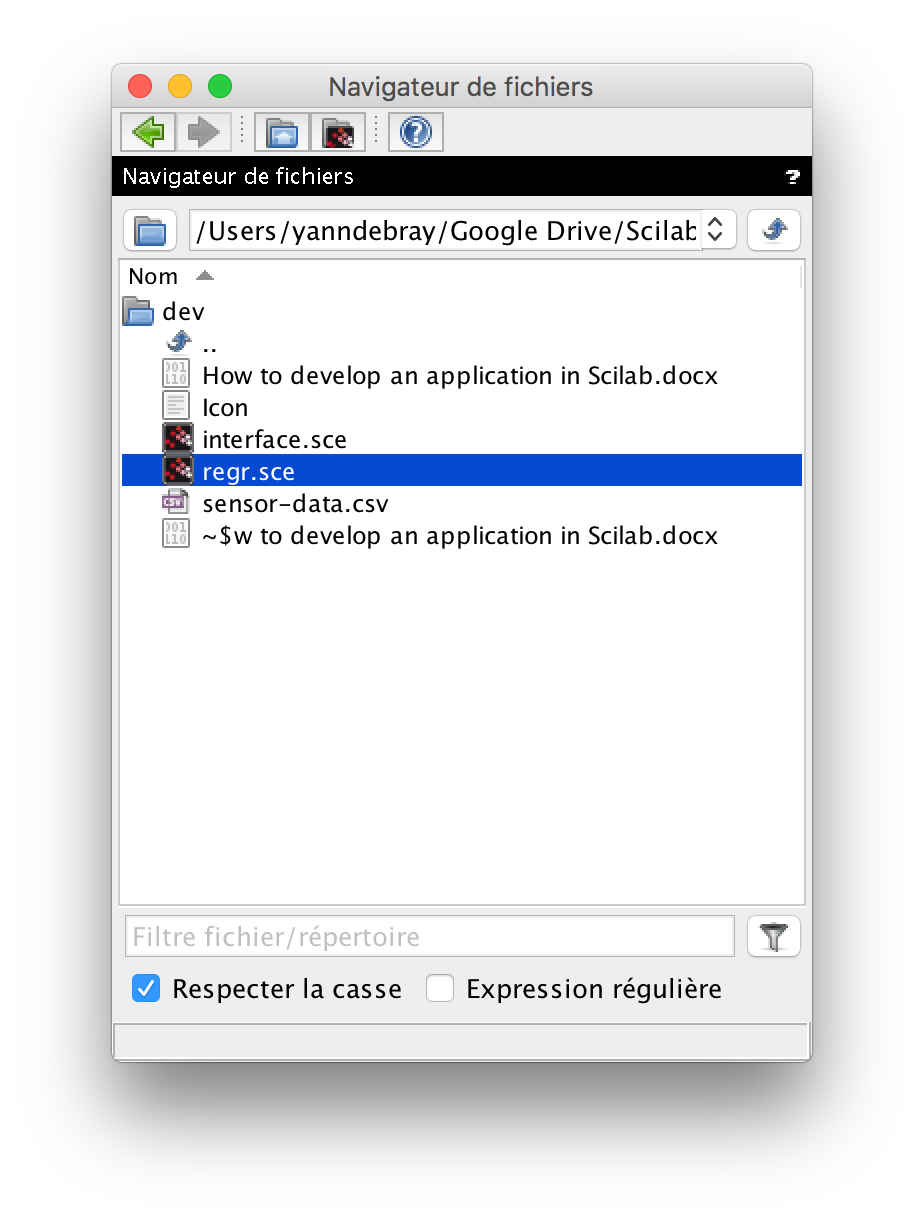
On the left side of the screen, you will find the file brower.
First, enter in the folder /dev

Open the script regr.sce by double clicking on it:
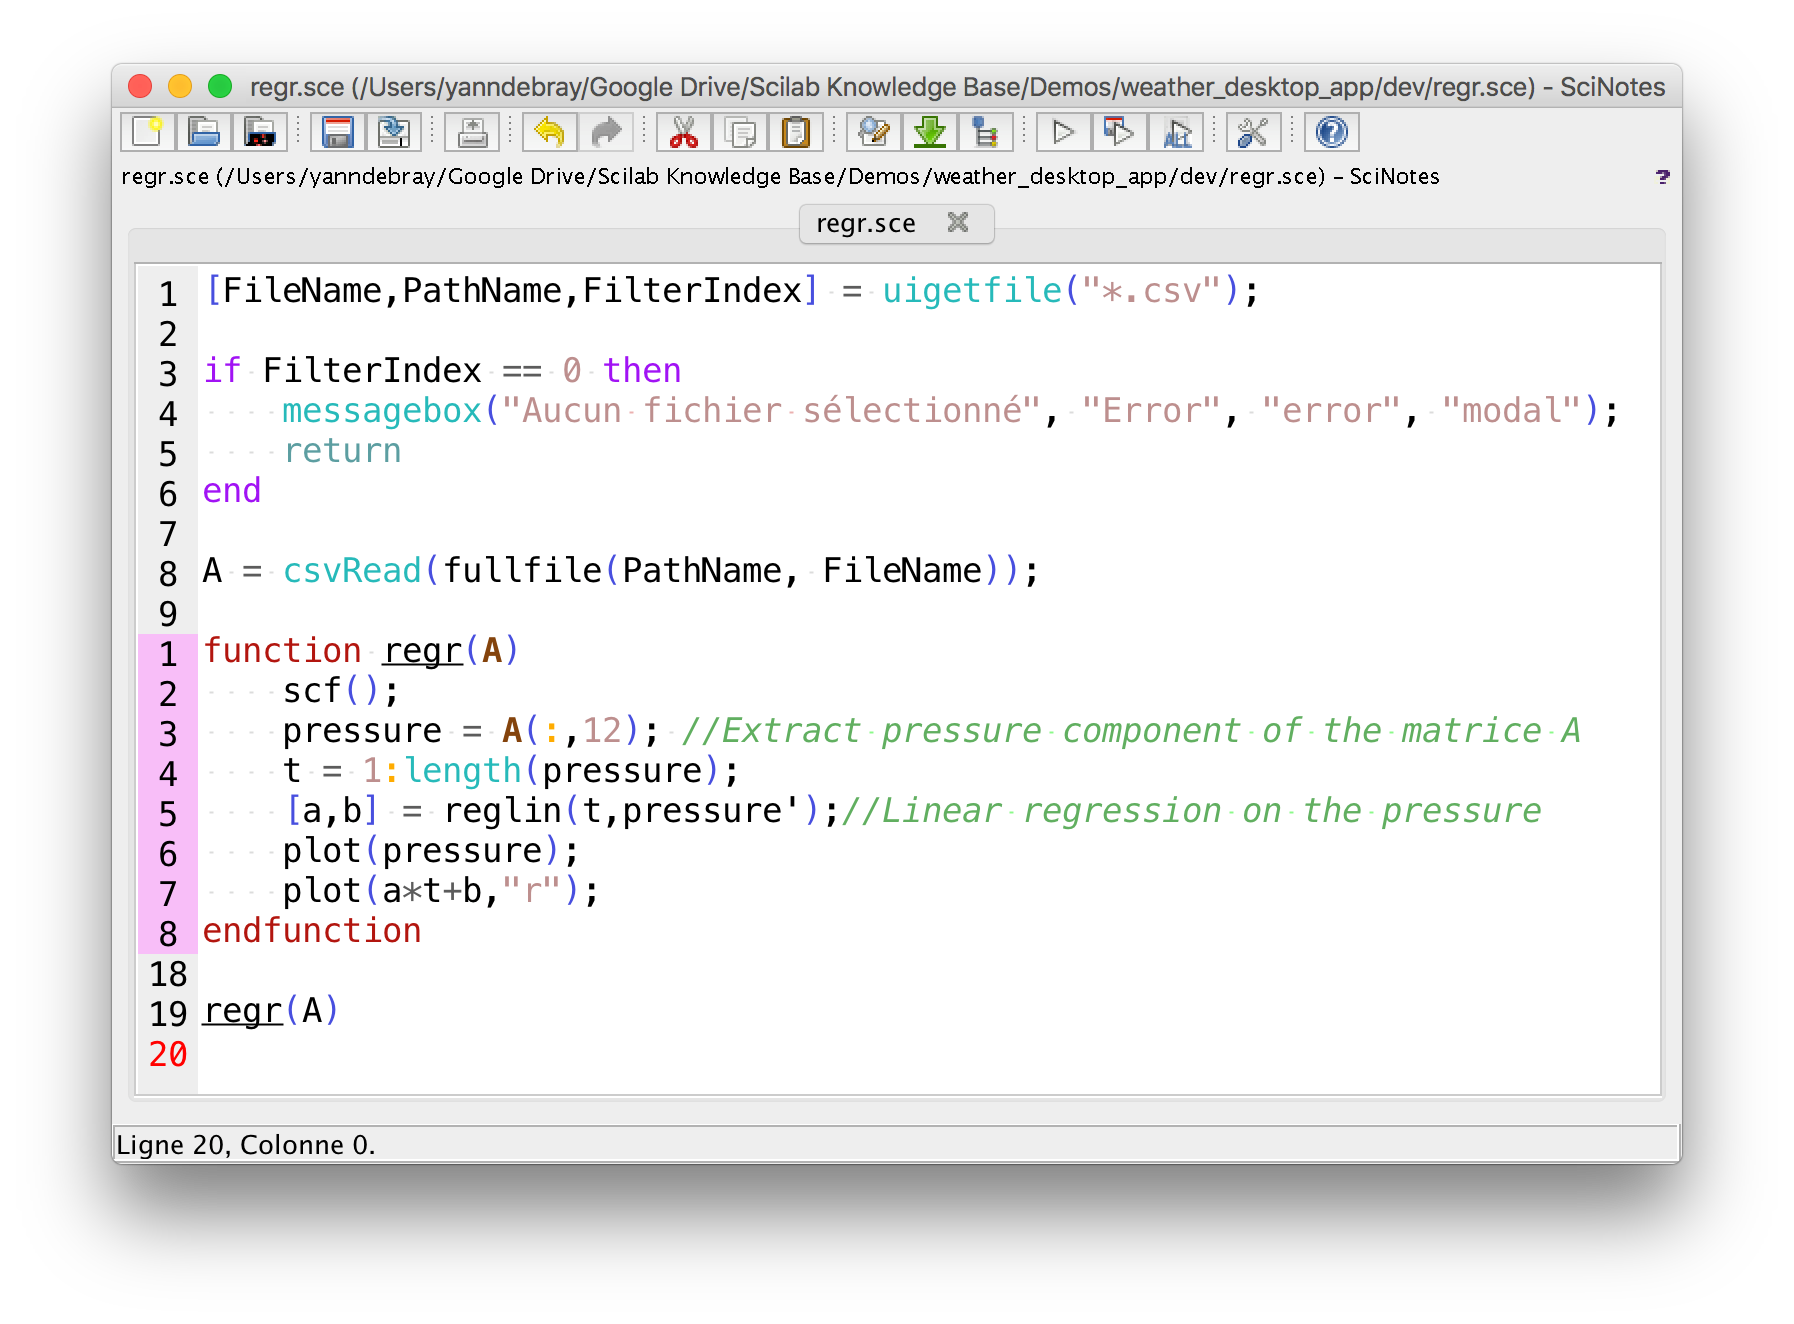
Scinotes – integrated editor
Open the script in Scinotes
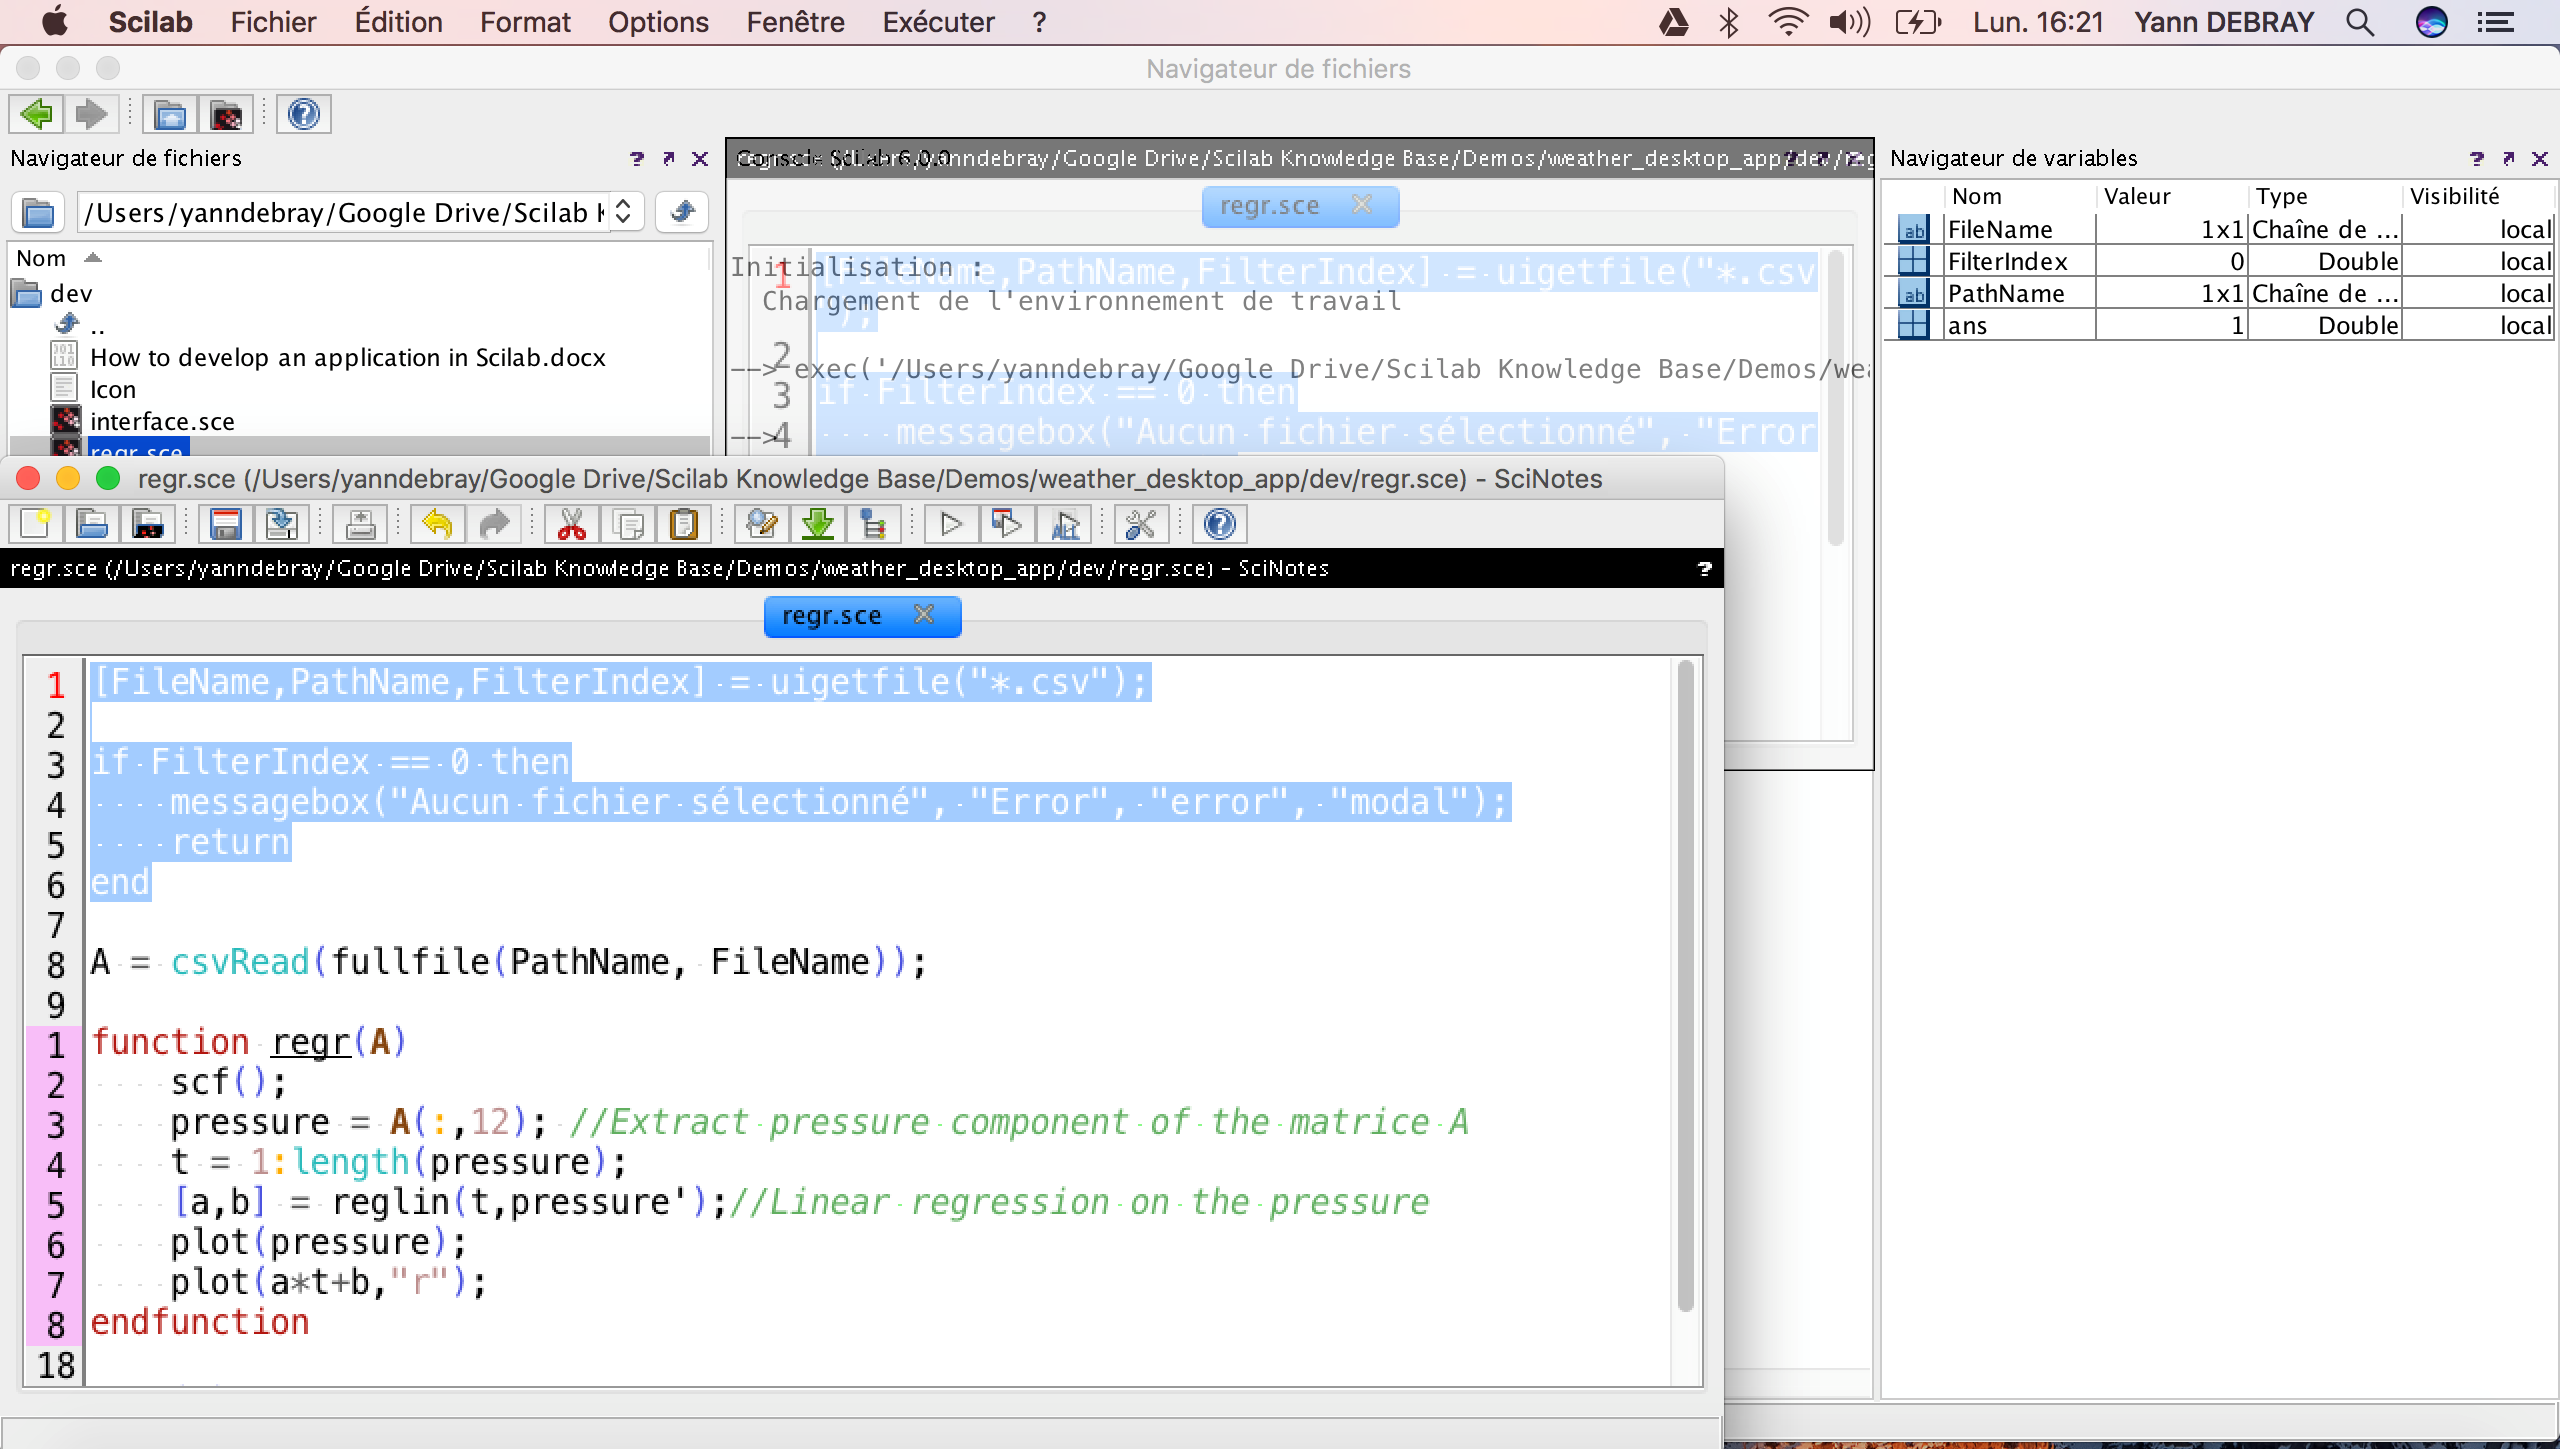
You can attach the Scinotes window to your default Scilab environment by drag and droping the black ribbon on the top of the window :
This is the script regr.sce:
[FileName,PathName,FilterIndex] = uigetfile("*.csv");


if FilterIndex == 0 then

    messagebox("No file selected", "Error", "error", "modal");

    return

end


A = csvRead(fullfile(PathName, FileName));


function regr(A)

    scf();

    pressure = A(:,12); //Extract pressure component of the matrice A

    t = 1:length(pressure);

    [a,b] = reglin(t,pressure');//Linear regression on the pressure

    plot(pressure);

    plot(a*t+b,"r");

endfunction


regr(A)
By clicking the play button, you run the script regr.sce (you can also do that without opening the file in scinotes, by right clicking the file in the file manager).
Import data
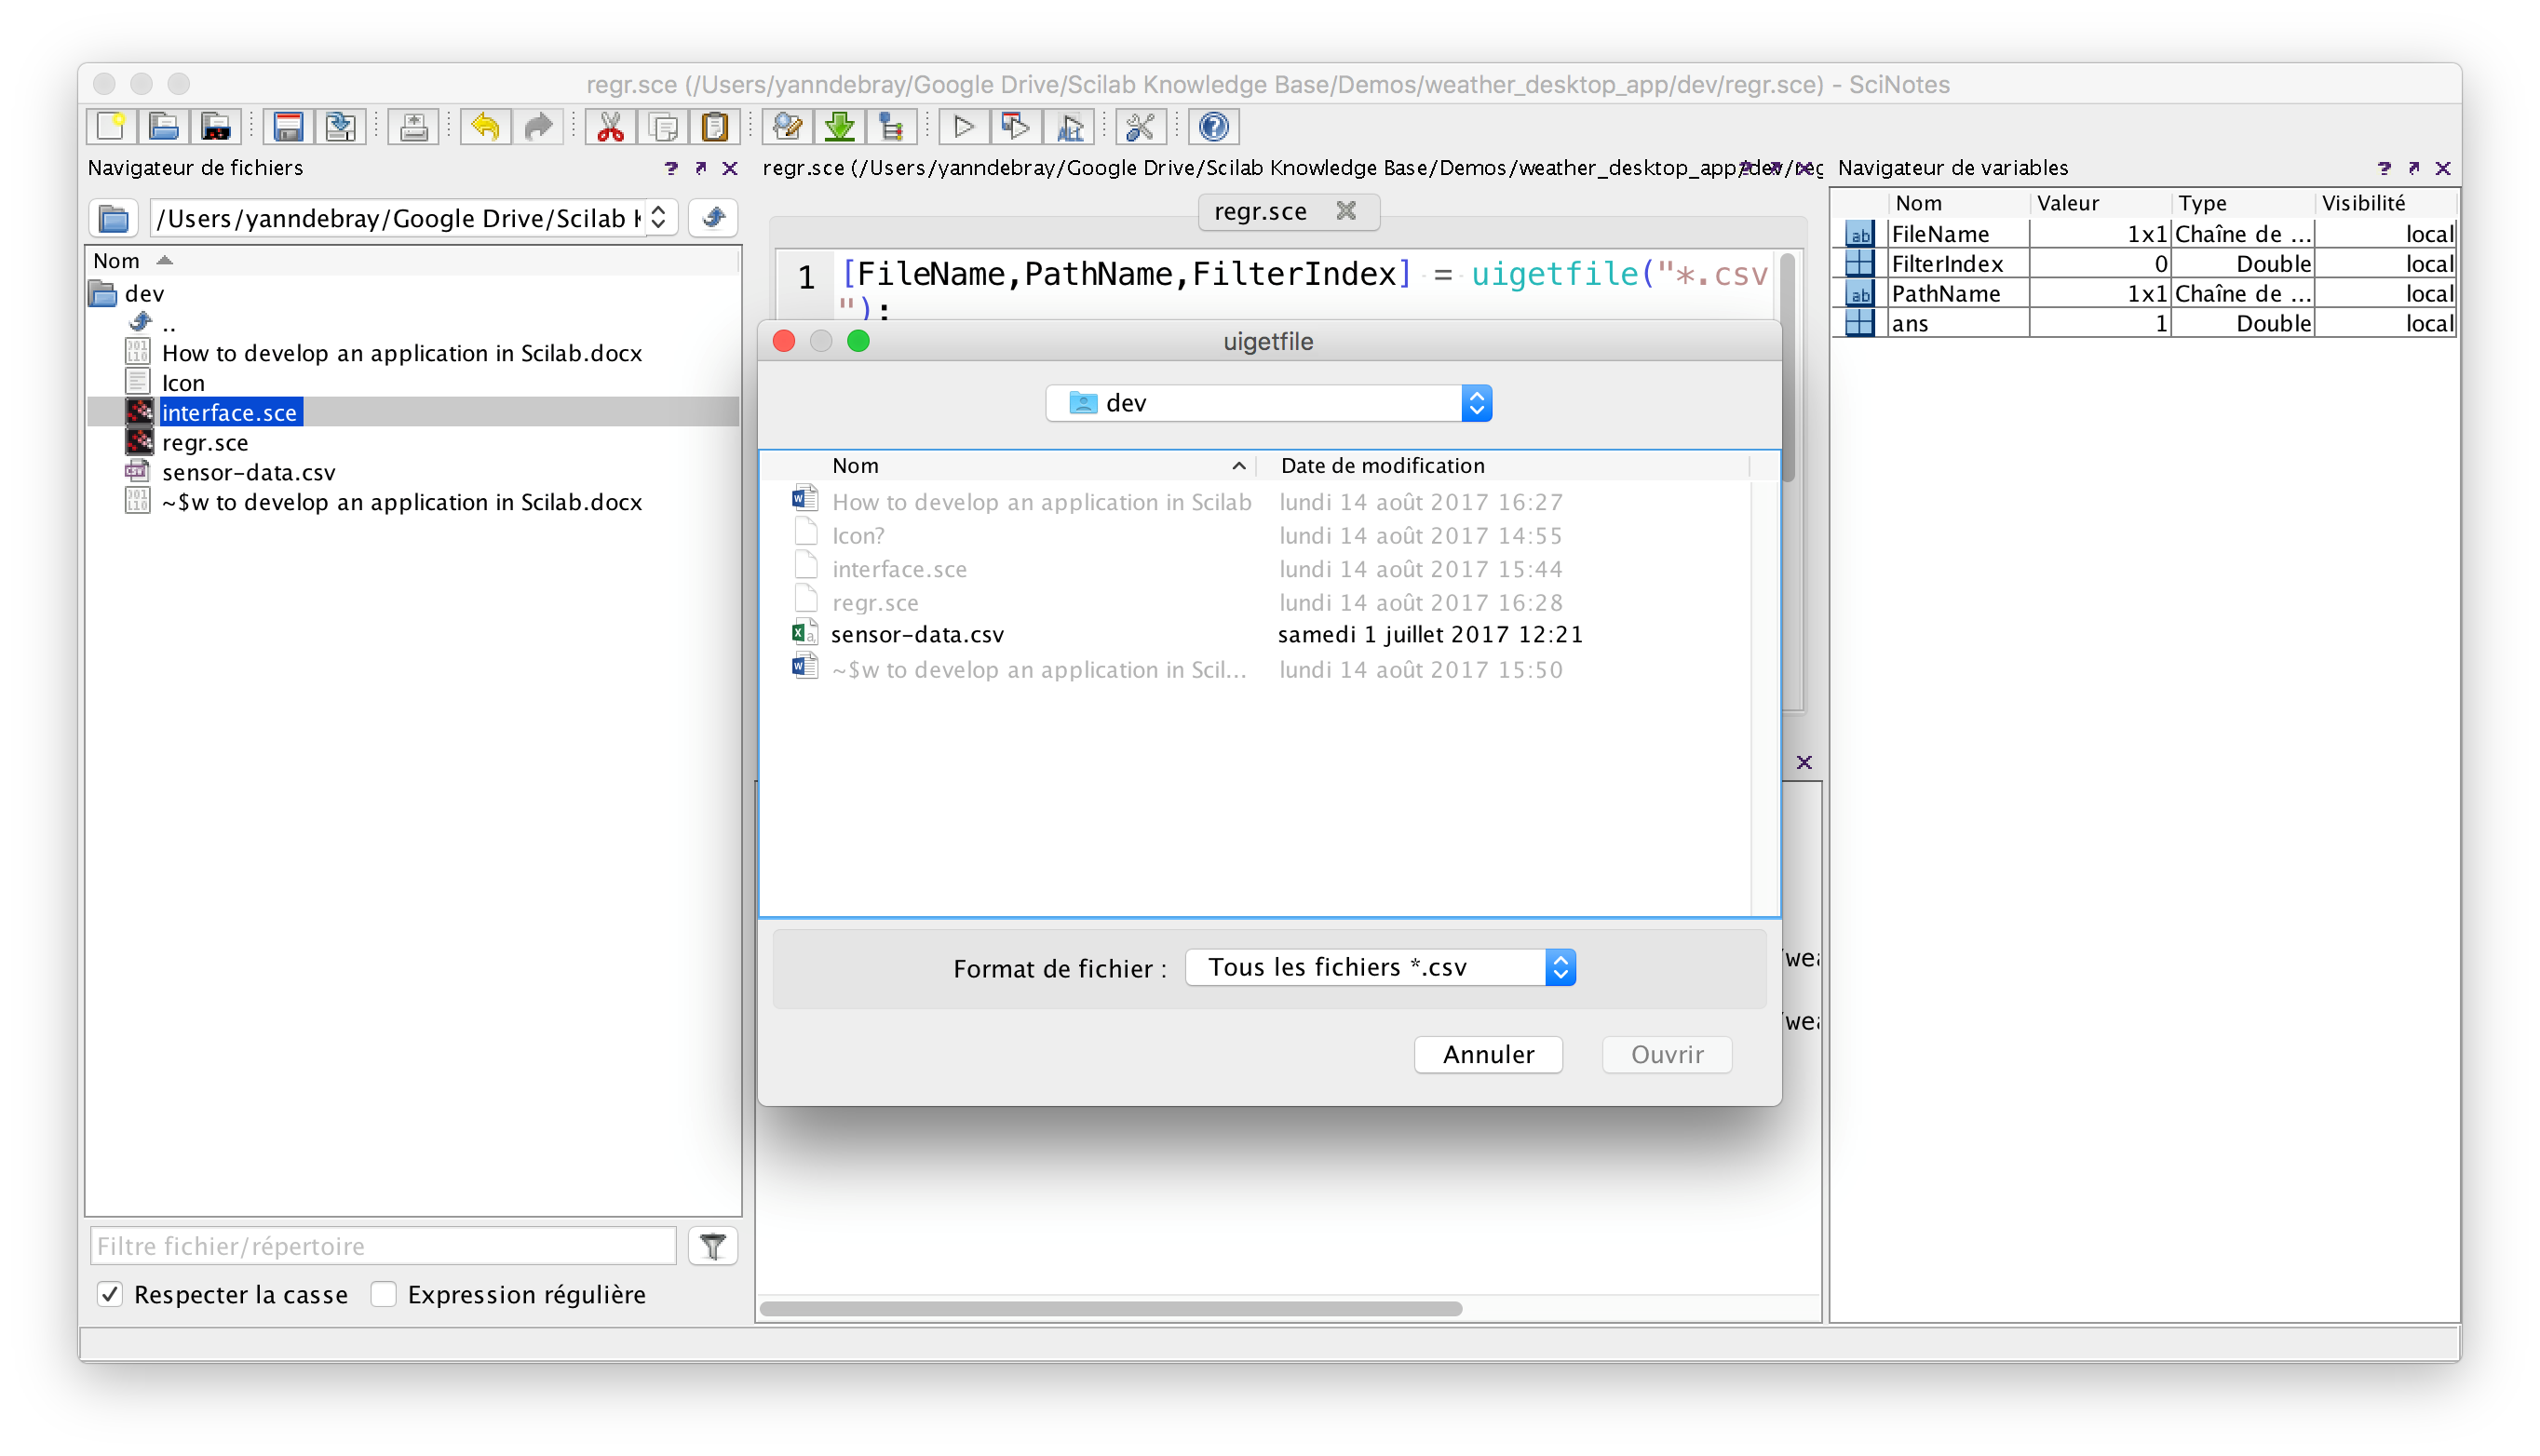
The first line opens a windows with the function uigetfile
By selecting the csv file sensor-data.csv, it returns the complete path of that file:
PathName  =


 /Users/yanndebray/Google Drive/Scilab Knowledge Base/Demos/wea

 ther_desktop_app/dev
It can then be given as input to the function csvRead, that reads comma sperated values in Scilab
A = csvRead(fullfile(PathName, FileName));
Variable browser & editor
It creates a variable A in our variable browser:
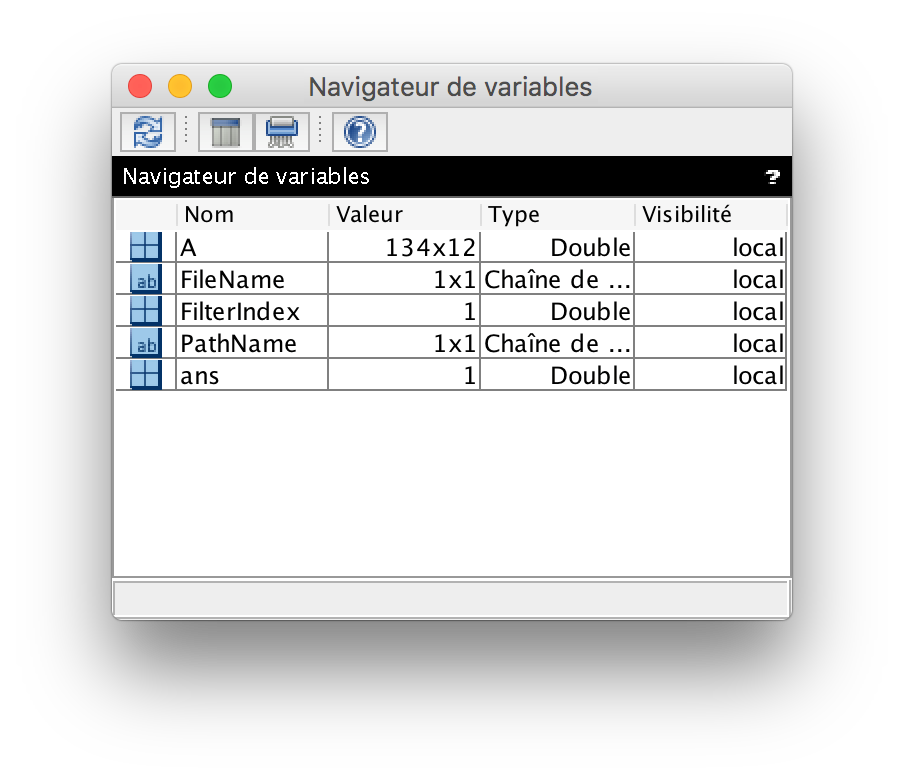
Double-clicking on the variable A will open it in a spreadsheet view called the variable editor:
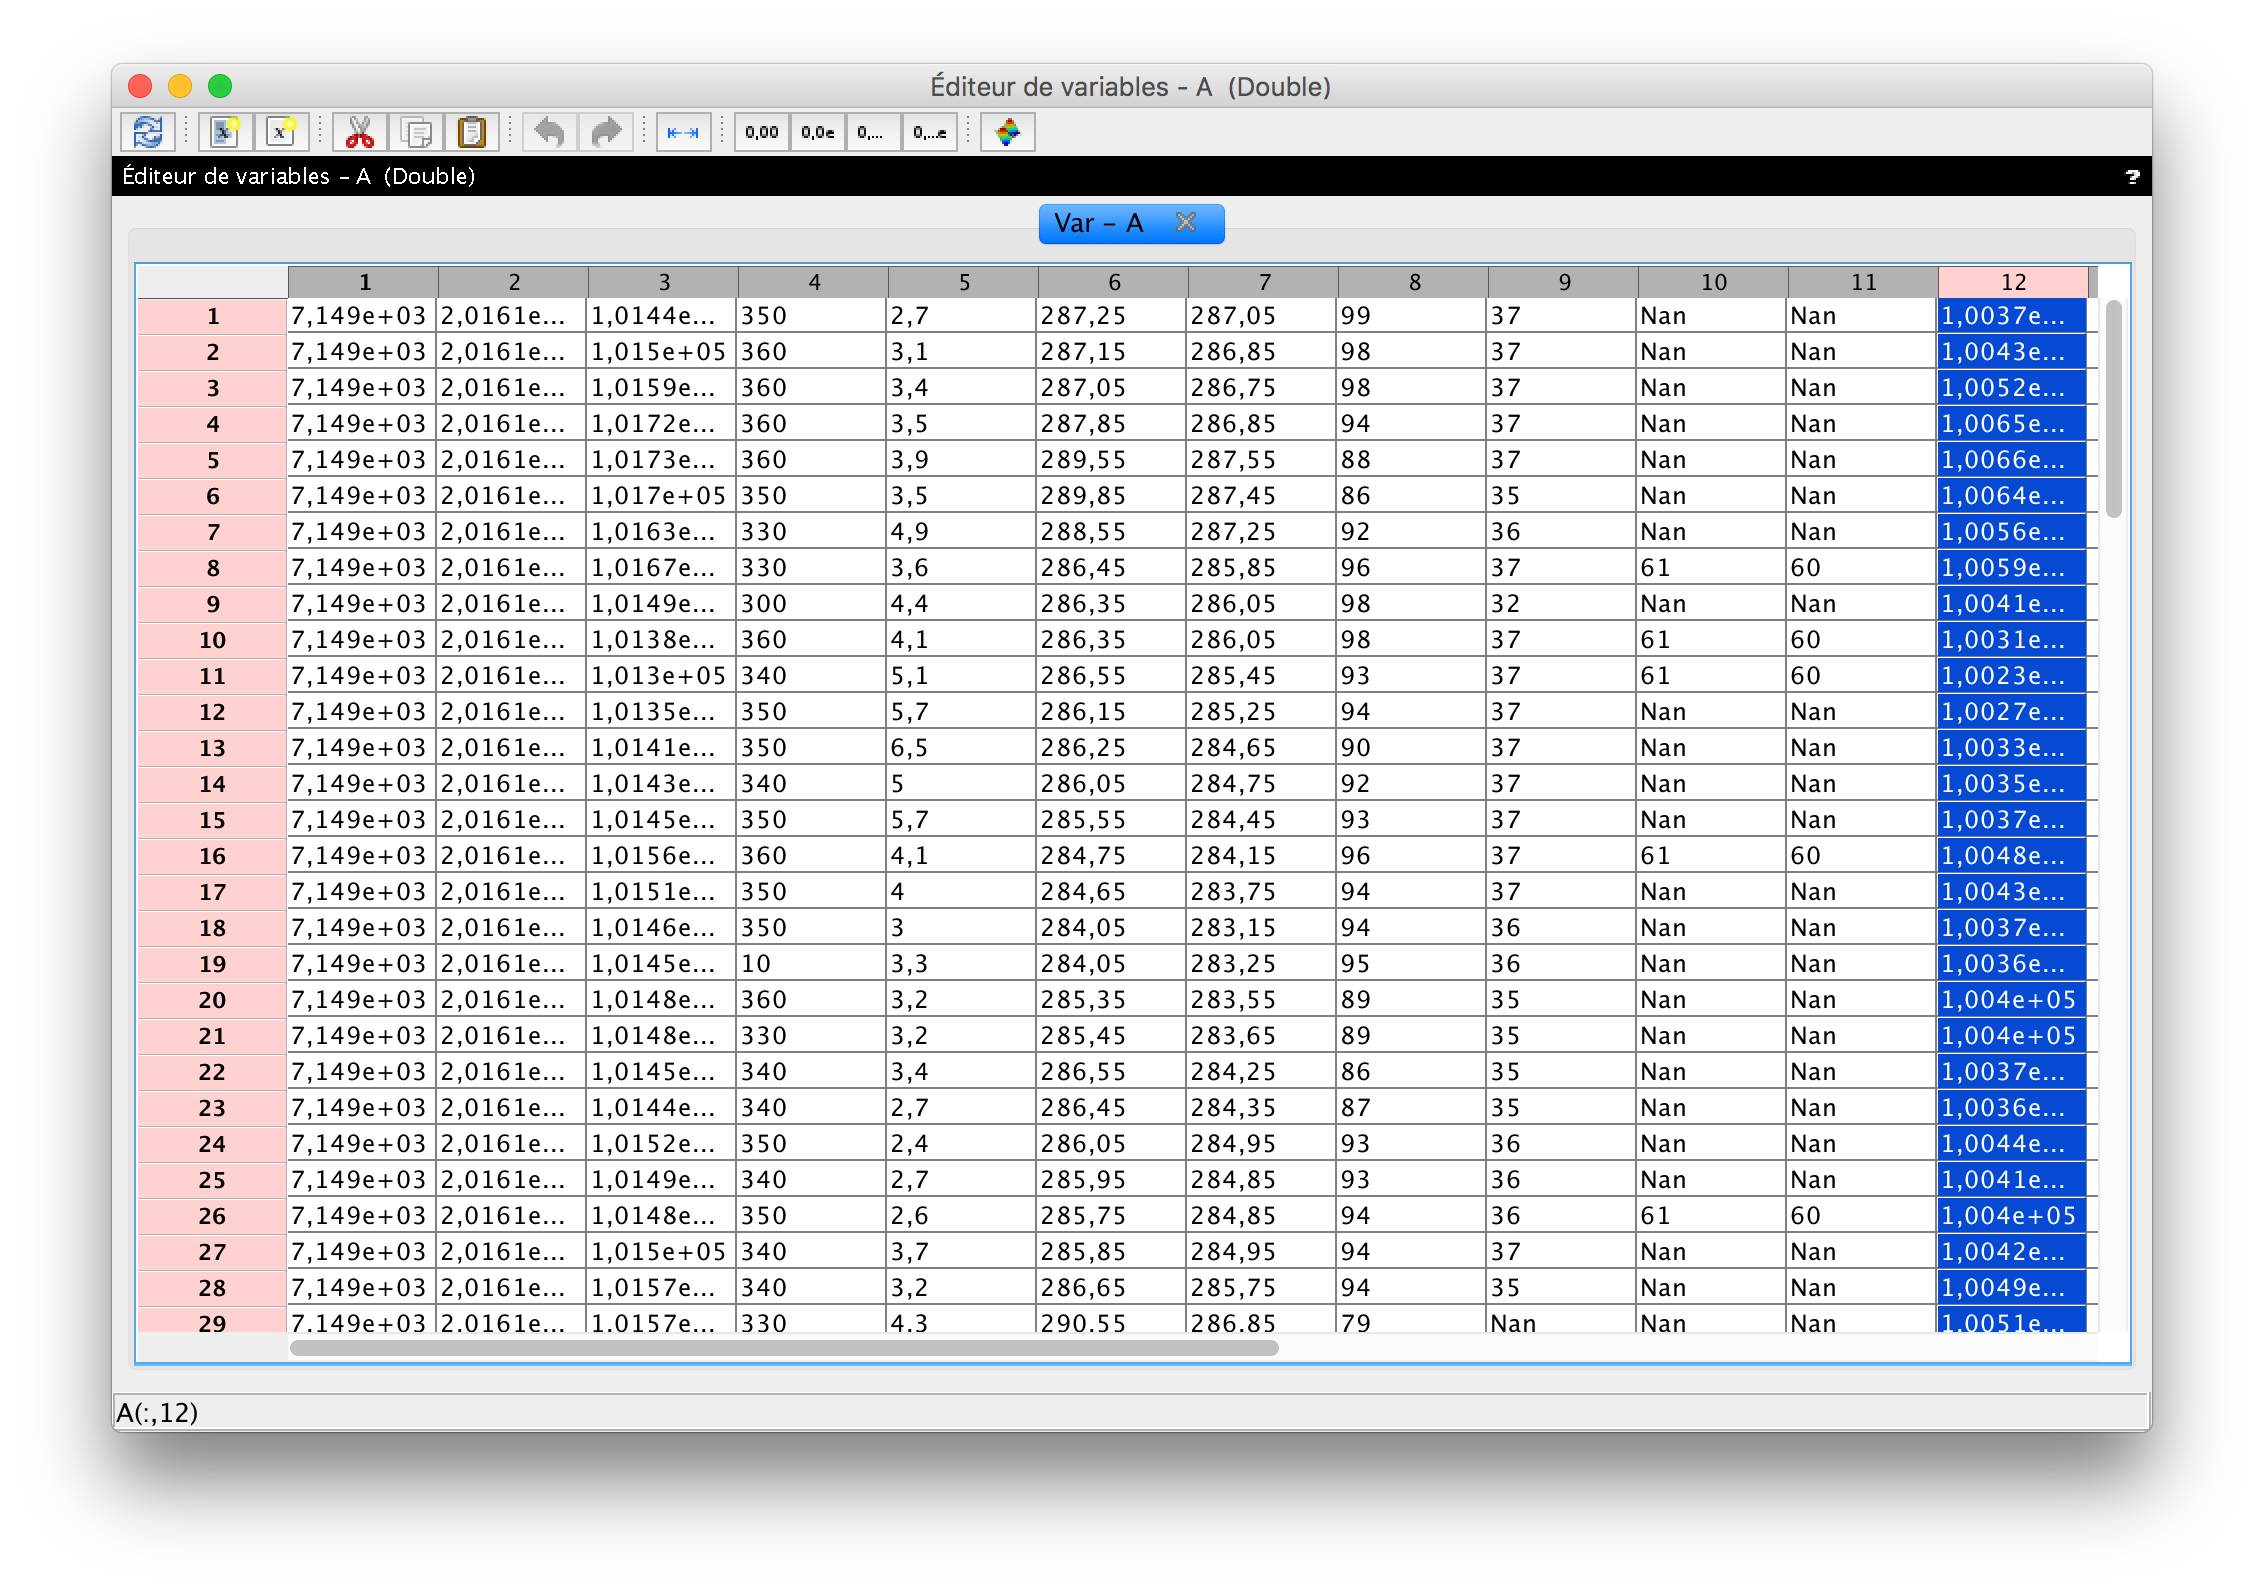
By selecting the 12th column of our matrix A, we are doing the same as writing in the console
--> A(:,12)
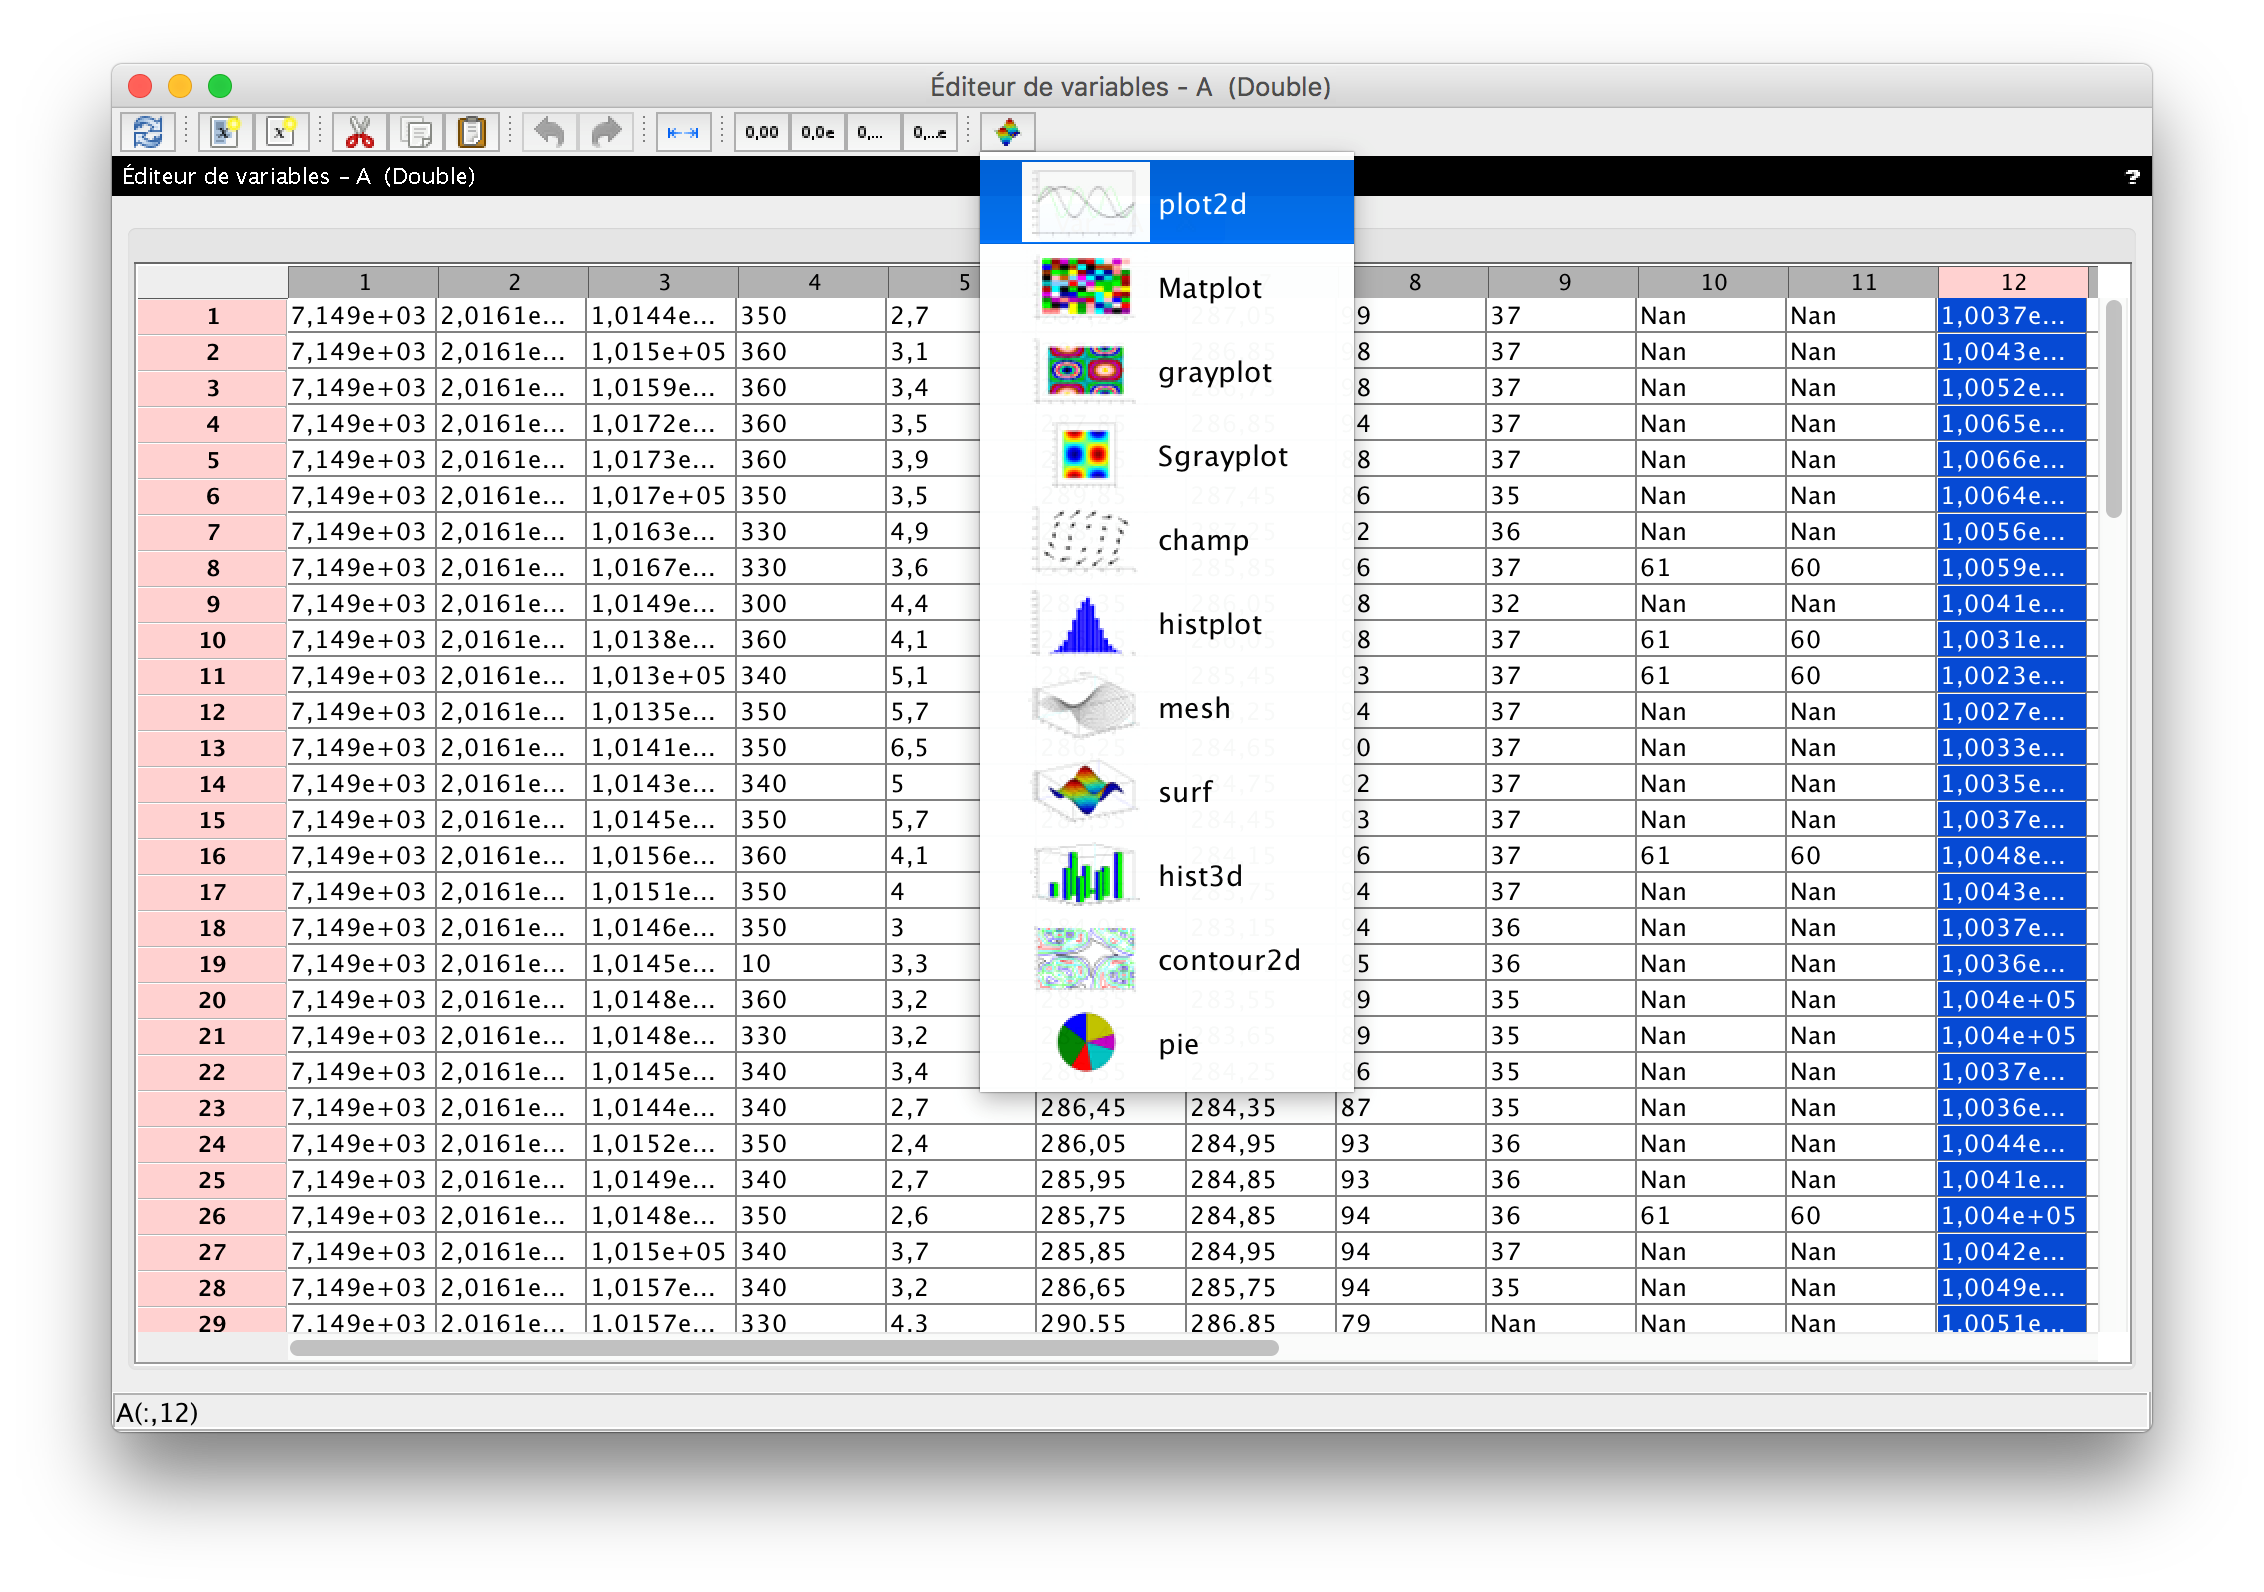
We can plot the result with the icon in the menu, or by typing in your console:
--> plot2d(A(:,12))
Writing functions
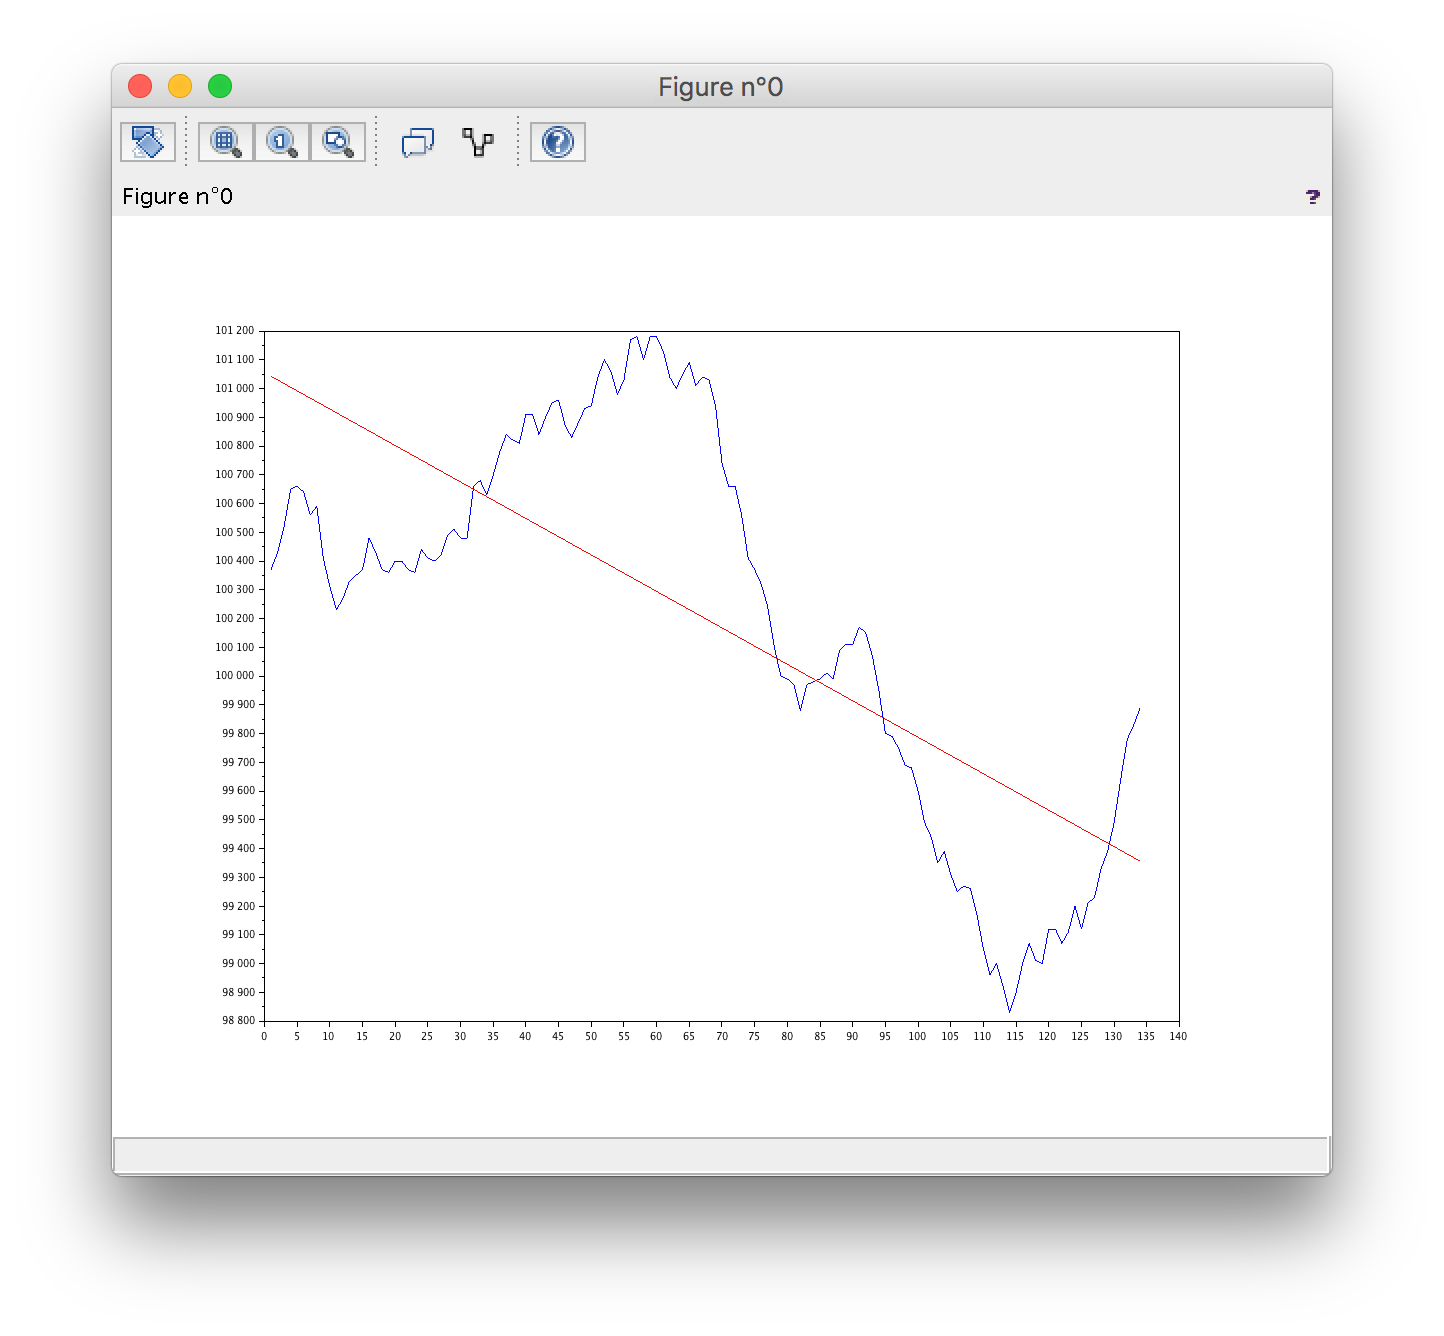
The following function takes as input a matrice A, select the 12th column, computes the linear regression on the data and plot it :
function regr(A)
scf();
pressure = A(:,12); //Extract pressure component of the matrice A
t = 1:length(pressure);
[a,b] = reglin(t,pressure');//Linear regression on the pressure
plot(pressure);
plot(a*t+b,"r");
endfunction
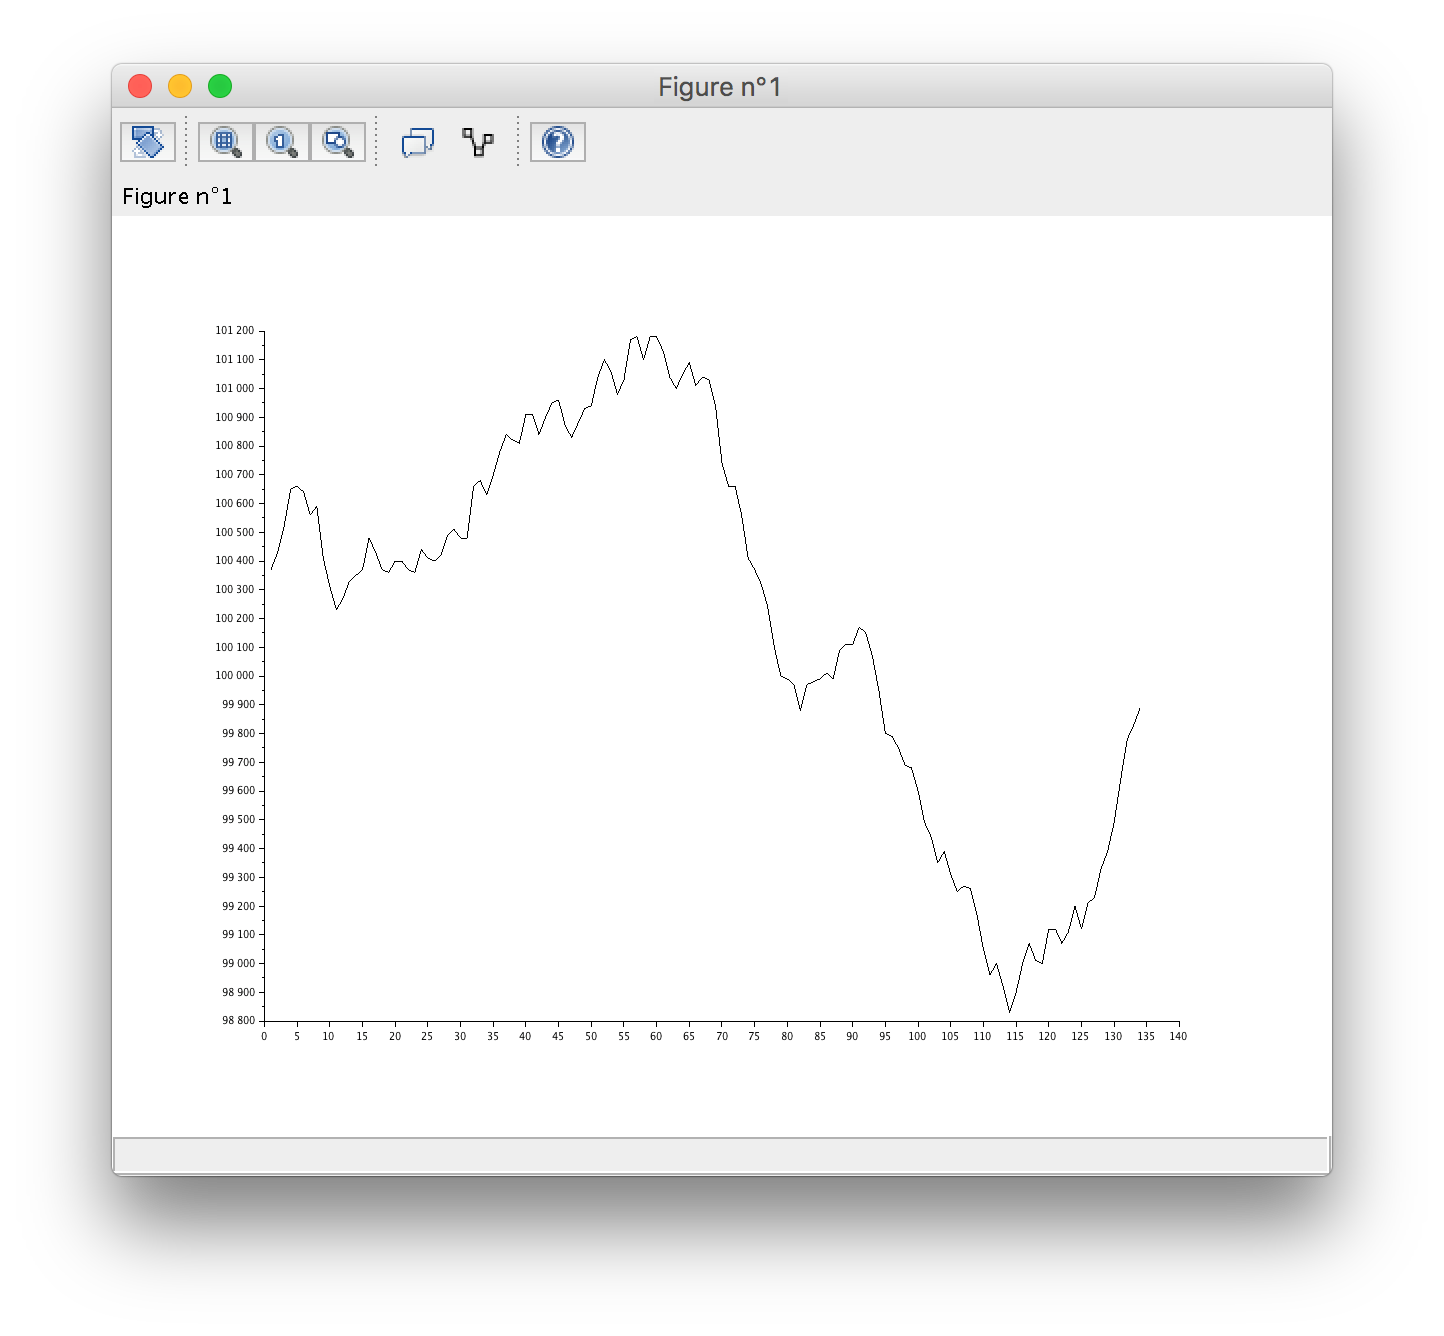
Once define, you can call the function as followed:
regr(A)
It will return the following graph:
Develop a Graphical User Interface
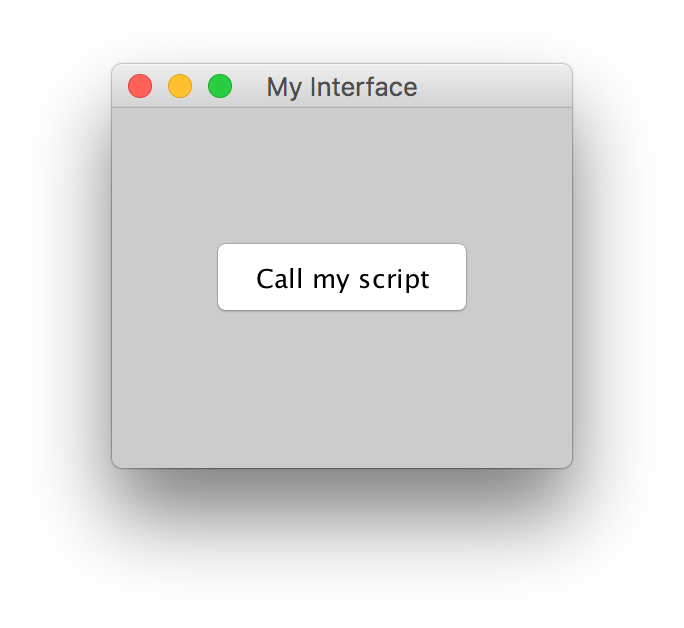
Open the script interface.sce:
f = createWindow();
f.axes_size = [230 180];
f.figure_name = "My Interface";
uicontrol(f, ...
"style", "pushbutton", ...
"string", "Call my script", ...
"position", [50 75 130 40], ...
"callback", "regr");
This produces the following window:
By clicking on the button “Call my Script”, it calls the function regr defined earlier, and produces once again the plot of the linear regression on the pressure data. (please note that you will need to execute the script regr.sce before, otherwise, the function regr will not be found and will return an error in your console).
In Scilab, the development of graphical user interfaces can be entirely performed with one main function, uicontrol:
h = uicontrol(PropertyName,PropertyValue,...)
In the next tutorial, we will teach you how to develop the following application for weather forecast:
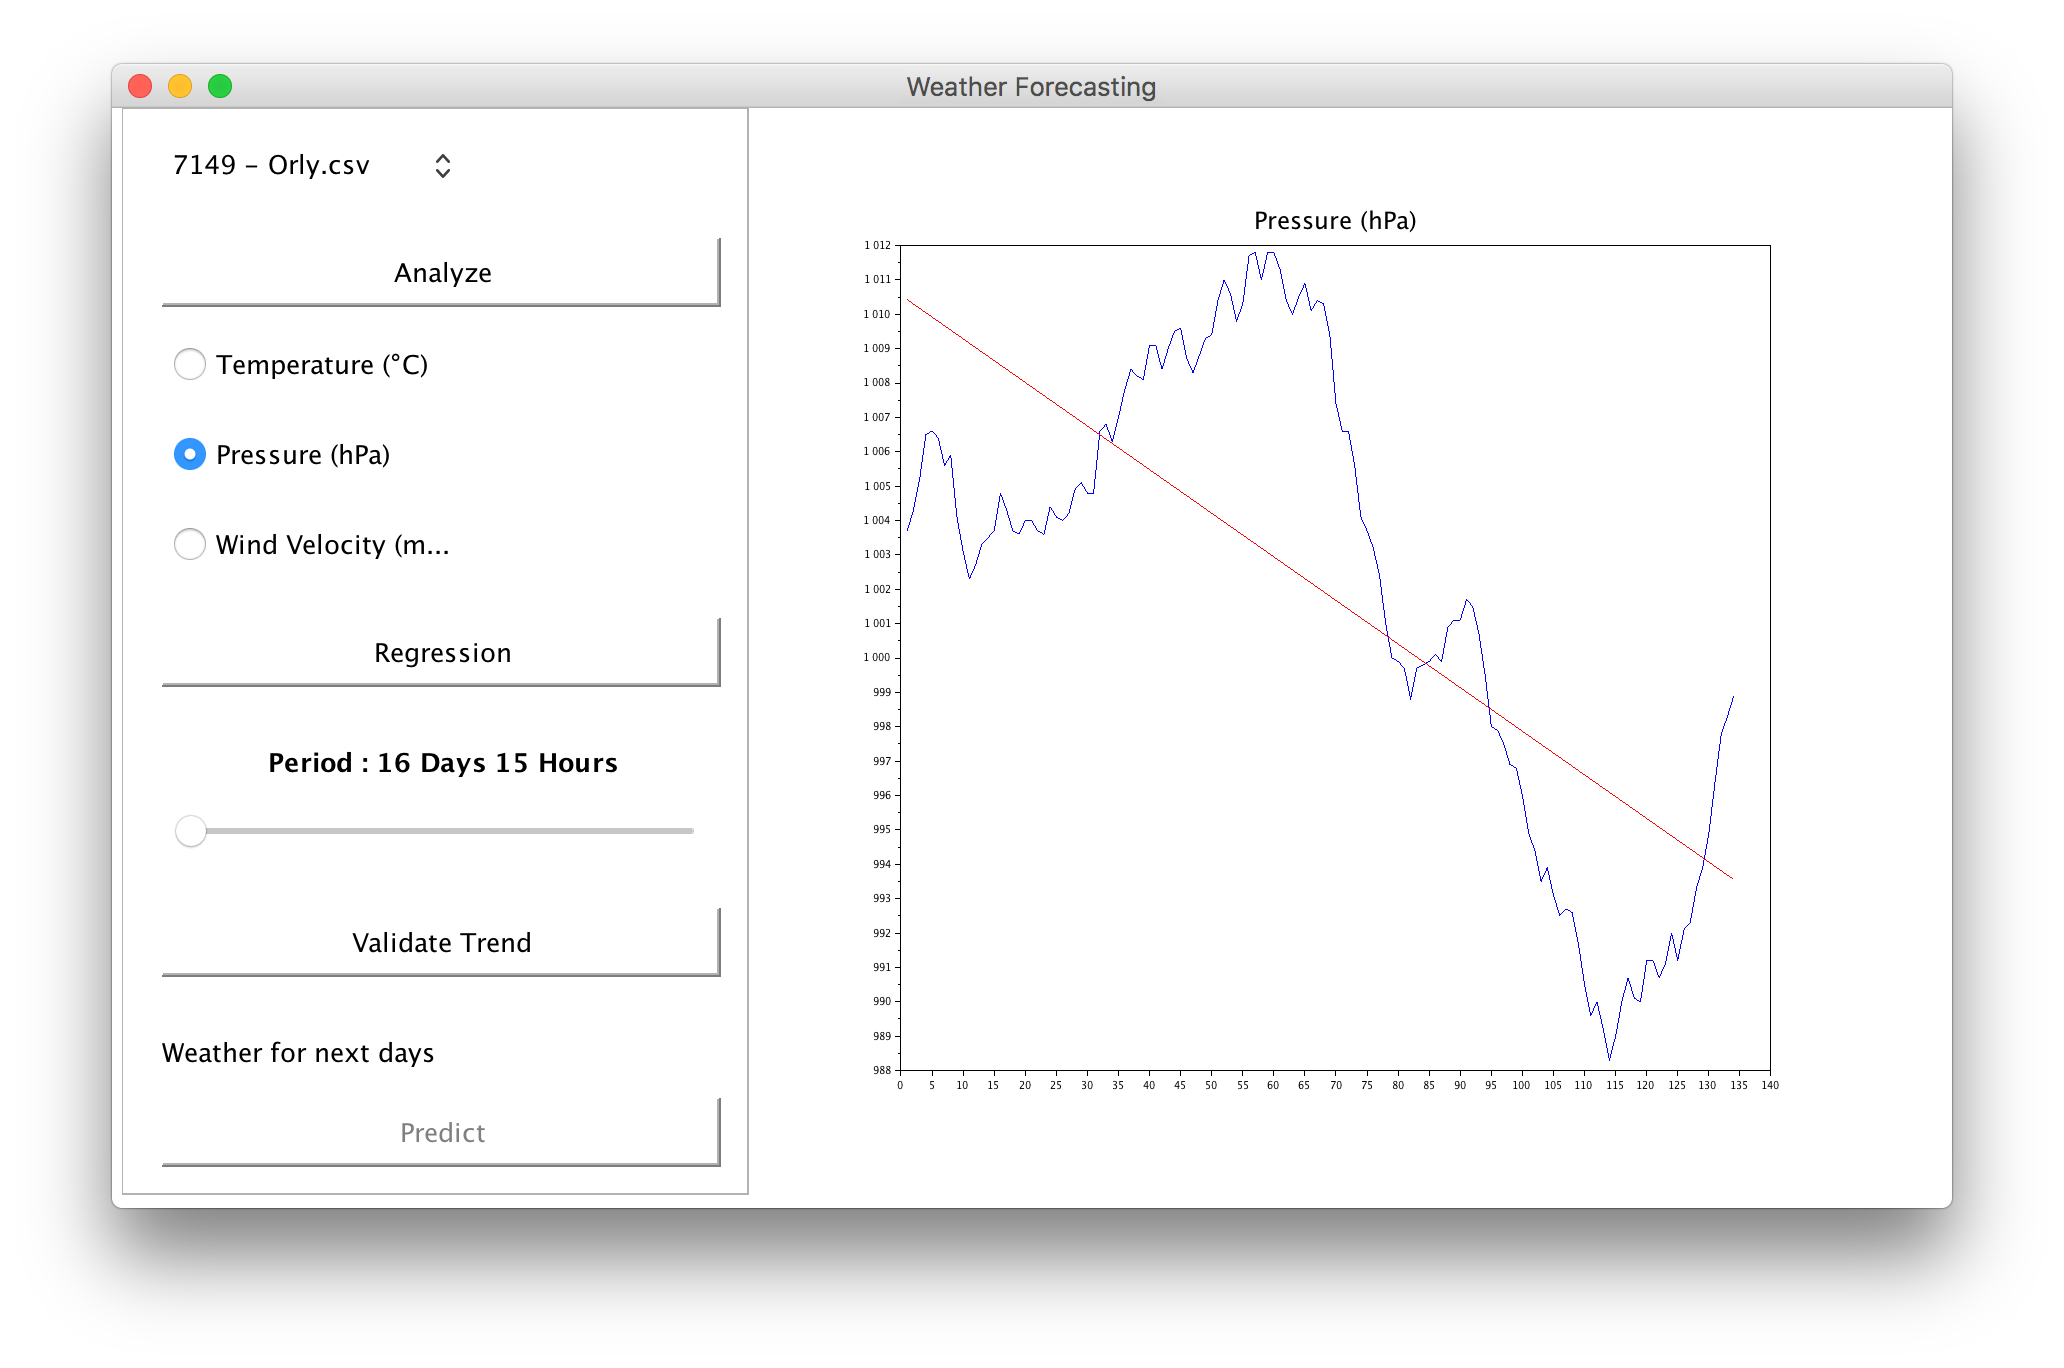
Read more on how to develop GUIs with Scilab.
![]()
This work is licensed under a Creative Commons Attribution-ShareAlike 3.0 Unported License.