Application Development – GUI building
There are some demonstration you can run from Scilab which give you a glance of Scilab capabilities on different subjects, and for example GUI. This tutorial will be a first approach for Graphical User Interface (GUI) building and will focus on the uicontrols 2 demonstration.
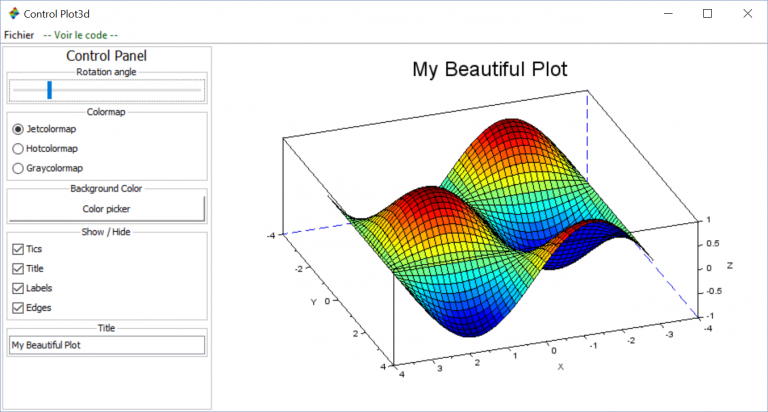
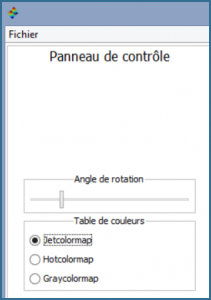
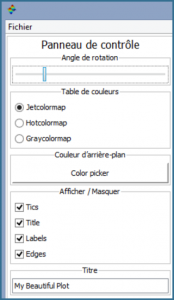
As you may see, this GUI is a graphic management interface. With that GUI you can easily rotate your plot, change the background and plot color, customize your frame labels and title.
In this tutorial, personal choice of name will appear in orange, Scilab function in blue, function’s arguments in green and object properties in red.
Main frame
So let’s begin by making our main frame called demo_plot3d created with the function figure and let the menubar visible. Then define your frame properties like figure_id, color_map, axes_size and also the figure_name : Control Plot3d. You can find all the informations you want on this page of the Scilab Online Help to customize your frame as you wish.
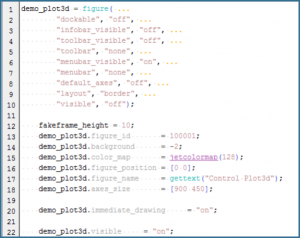
As you may see in this example, you can make the all frame visible by turning the figure argument “visible” in “on” or turn your frame properties immediate_drawing and visible in on. We’d rather use this last method and keep this two lines at the end of the script. Thus your graph modifications will appear automatically.
We will now divide this frame by adding a menu on the menubar and dividing the frame into a Control Panel and a graphic display zone just as follow.
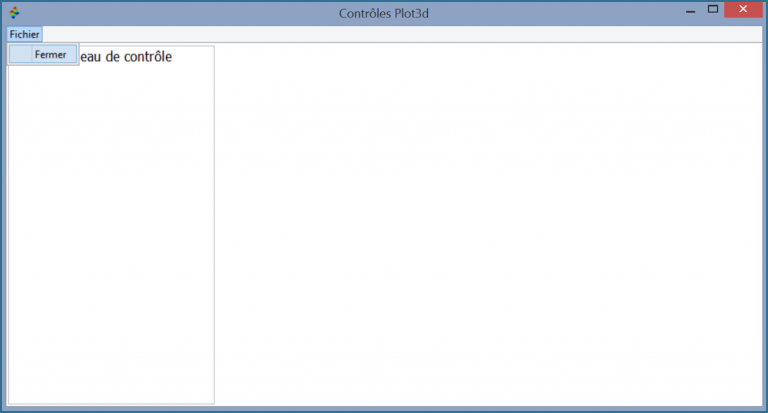
So use the uimenu function to create a first menu h labeled as File for example and a second layer menu in h uimenu(h, … labeled as Close in order to delete your main frame.
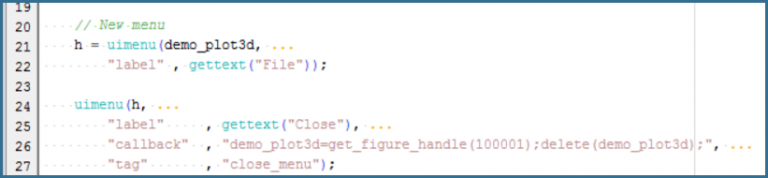
The callback argument of uimenu functions is the action that will be executed when you click on the Closeoption. So here let’s get_figure_handle with its figure_id you defined previously and delete it.
Left and right frame
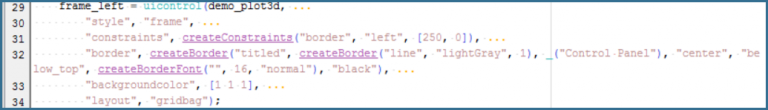
Now create your new frame frame_left in demo_plot3d and define its style as frame. You will have to specify the layout of your new frame in the main frame with the constraints functions: In our example, we will use a border with content laying on the left with a width padding of 250px. To draw this border and add the Control Panel title just use the createBorder function. Finally, specify that you will layout the content of this frame following a gridbag in order to make it clean.
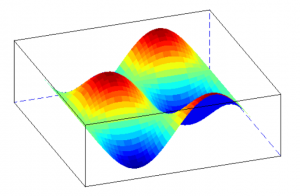
You can create your right frame frame_right the same way and now add your graph to display. Create the axes with newaxes() and define your plot with plot3d(). For this demonstration we are using the default 3D plot of Scilab that is why the plot3d() function does not have arguments.
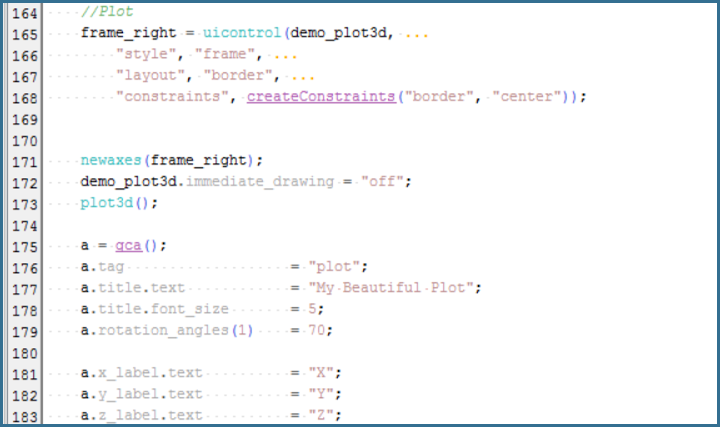
Feel free to add description on your graph axes by defining its properties such as title, initial rotation_angles (here default value is set at 70°) and axes_label . You can get the axes handle with the function gca().
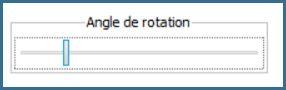
Slider for graphic rotation
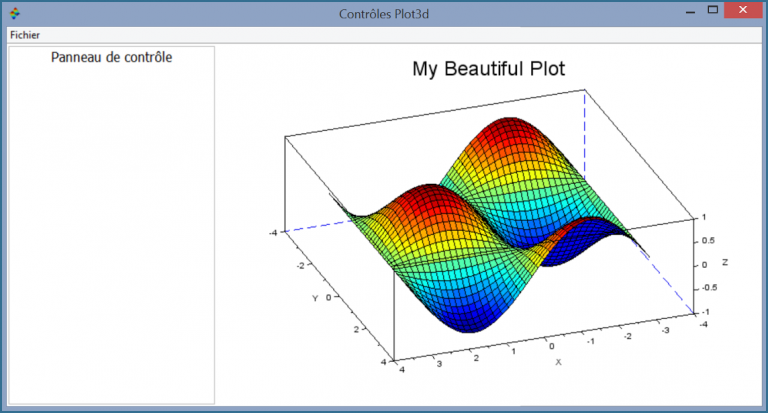
After these first steps you should have ended up with something like this :
Now that the main frame is structured we will add the first ui components : the rotation slider
Make a new frame called frame_angle from the parent frame_left in order to host the slider and set it on the gridbag in second position [1, 2, 1, 1] .
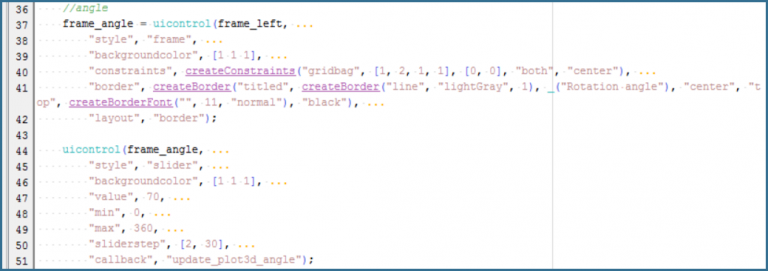
Then create the slider with uicontrol by defining parent frame and style and customize it by setting the min, max and default value. Finally put the name of the callback function that will be applied on the graphic display update_plot3d_angle and define it as follow.
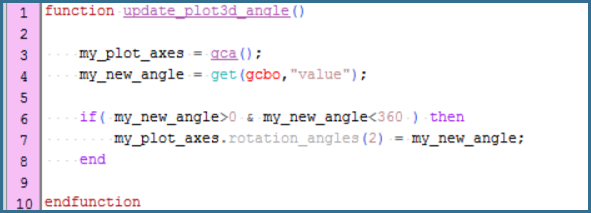
All you have to do is to get the value of the angle settled by the slider that you can get thanks to the get function that will return the value properties of the handle gcbo related to the object whose callback is executing.
You are now able to see and make your graph rotate.
Defining the colormap
The whole control panel options are layouted as seen before. So for the colormap we will begin by making a frame named frame_colormap in frame_left and set it on the gridbag on the third position [1 ,3, 1, 1]. To make this frame suitable for three radiobuttons, you can add a grid [3, 1] as a layout_options and activate it by setting the layout properties of the frame_colormap as grid.
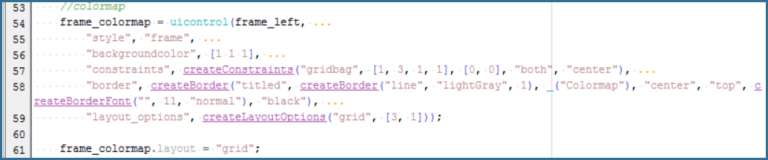
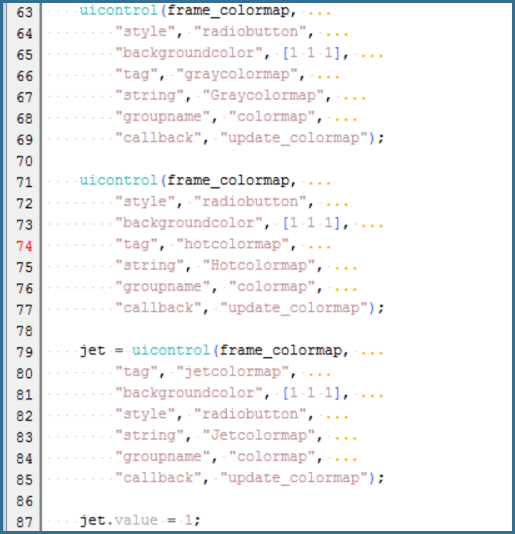
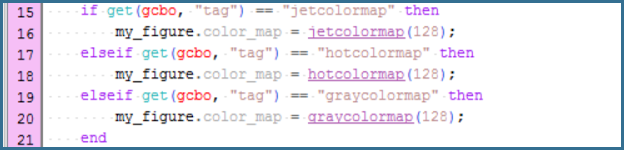
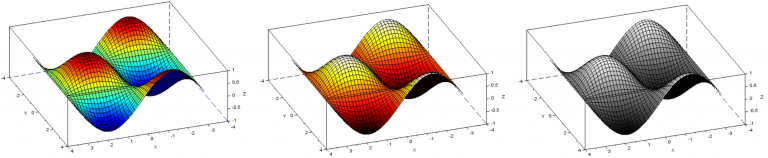
Now you can create your three radiobutton (style) in the frame_colormap. In this example we made 3 color maps (gray, hot and jet) that will all refer to the same callback function update_colormap. Make sure you set the tag properties since it will be used in the callback function.
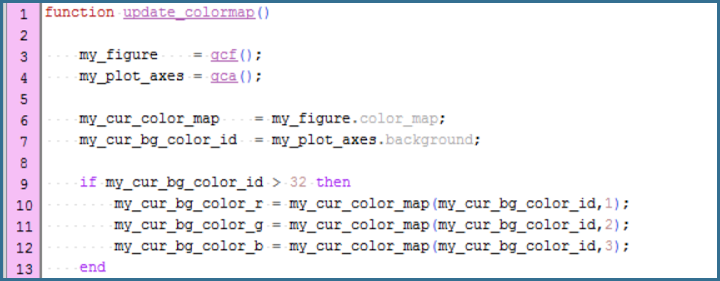
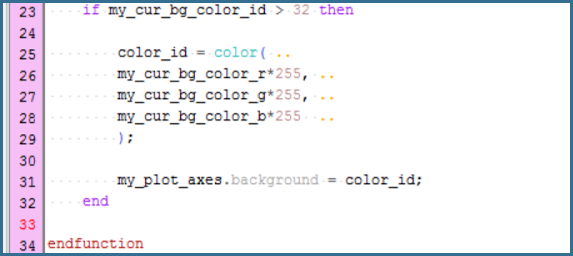
The callback function simply consists in changing the color_map of your figure. But be careful. Changing the colormap will also change the background color based on it. The default color_map contains 32 element. So be sure it hasn’t changed already or else get the RGB format background color.
Then just change the colormap by using the color_maps available on Scilab (see here)
Finally, if your background color has actually changed, replaced it with the initial RGB value.
You are now able to change your graph color as follow
Graphic background color
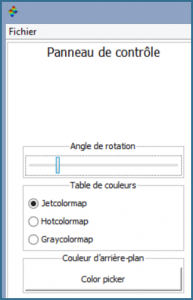
Your new frame here will be frame_background in frame_left and set it on the gridbag on the fourth position [1 ,4, 1, 1]. This parameter will be activated via a pushbutton style ui component tagged as button. Feel free to show relief on this button when raised.
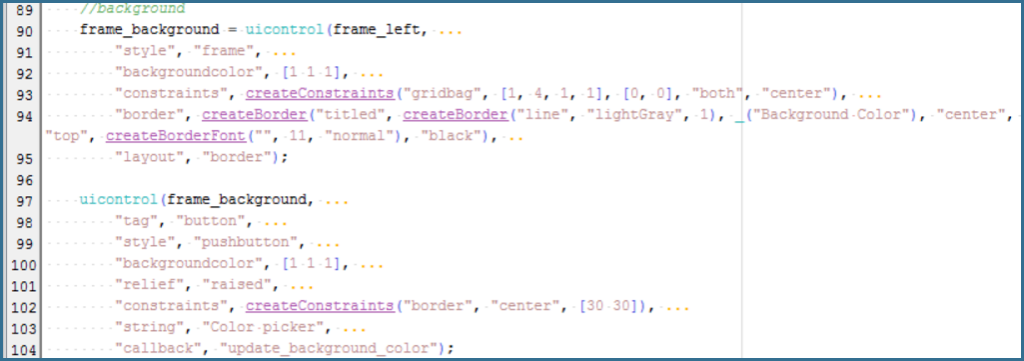
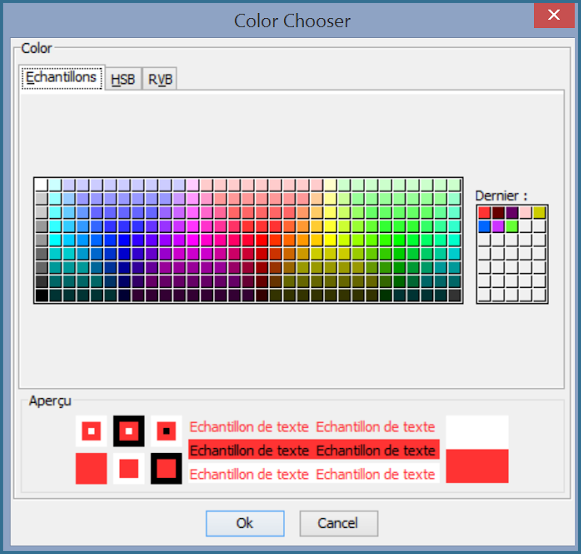
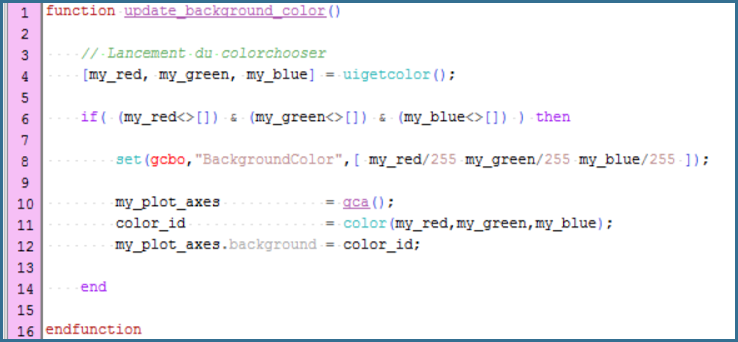
The callback function update_background_color will simply launch the native color chooser uigetcolor of Scilab. You can then applicate the chosen color to your background by changing the properties of your axes.
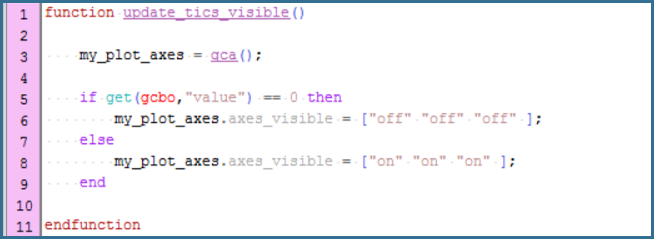
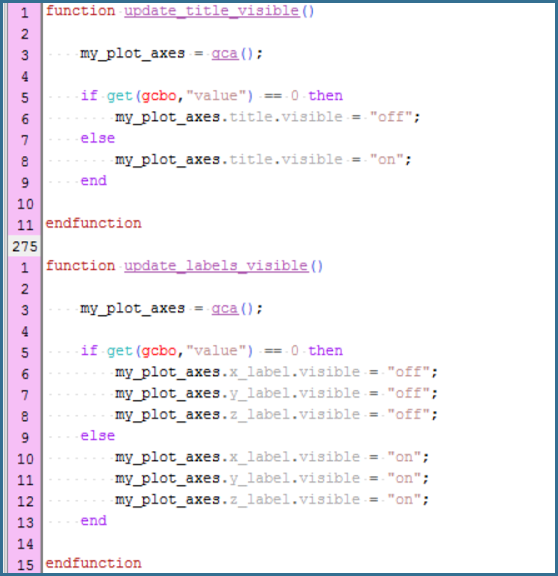
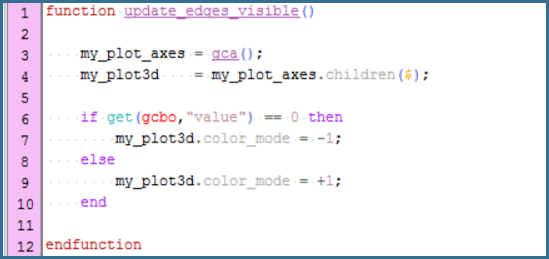
Show/Hide tics, title, labels or edges
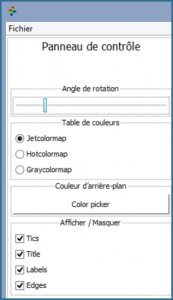
This frame is quite similar to color map frame.
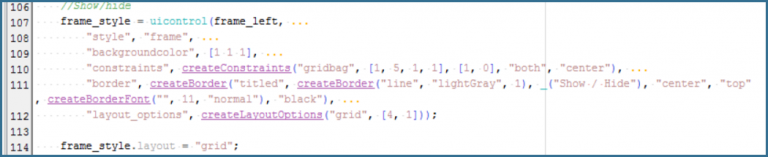
Use a grid to layout properly the four following checkboxes and notice that the value property of each is initially set to 1.
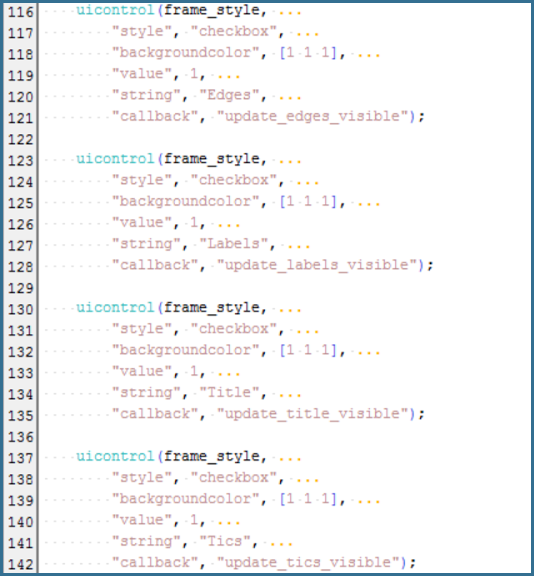
The callback function consists simply in changing the visibility property of axes, axes title, axes labels and figure color mode (-1 : without edges ; +1 : with edges) according to the value property of the each checkbox.
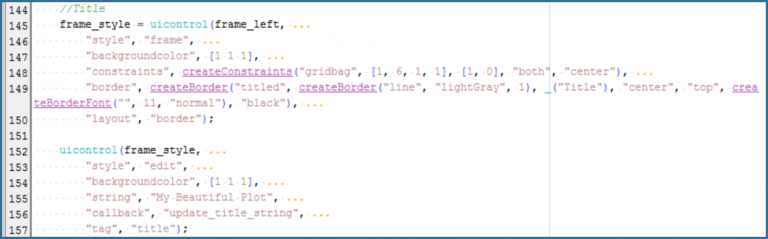
Graphic title
This is the last step of this tutorial. Just create your last frame called frame_style and put it an edit styleuicontrol. You can set a default text if you wish. Use the string property and set the default name of the plot : “My Beautiful Plot”
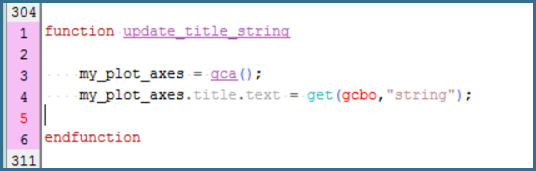
The callback function will just have to change the title property of the axes.
Conclusion
With this tutorial you saw that it is possible to make a clean and operable GUI with Scilab that suits an application. If you want it to be easier we invite you to try the Gui builder toolbox available on ATOMS. You can find video tutorial on it on youtube :
- Create a GUI using drag-and-drop interface of Gui Builder and generate associated code
- Interactive application for plotting graph