Application development – Debugging
As an expert, you often have to develop your own scripts and to package them in an operable and good looking application. This tutorial is the first of a serie that will help you to develop your own scientific application with Scilab.
Debugging on Scilab 6
If you began coding, you know for sure the tremendous value of this tool that allows you to effectively find and correct possible mistakes in a large amount of code lines. Although it doesn’t provide an user interface yet, Scilab 6 offers you a full-featured debugger (more information type the command line help debug).
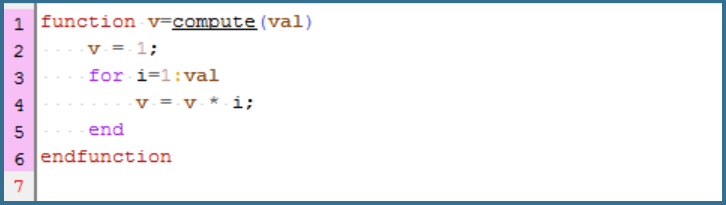
Let’s see what it can achieve on a simple function like compute:
Run your code and enter the debug mode with the command debug()
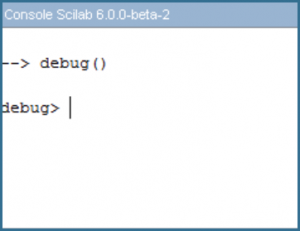
From here you have now access to the help by simply typing help (or h) and could turn back to Scilab normal mode by typing quit (or q). But I think we agree on the fact that quitting is not an option.
Breakpoints
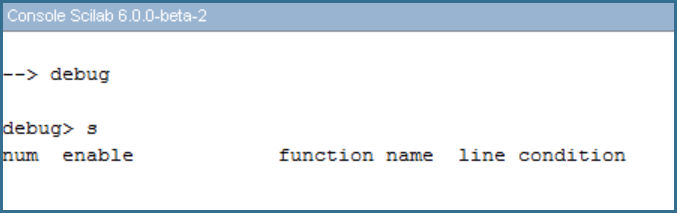
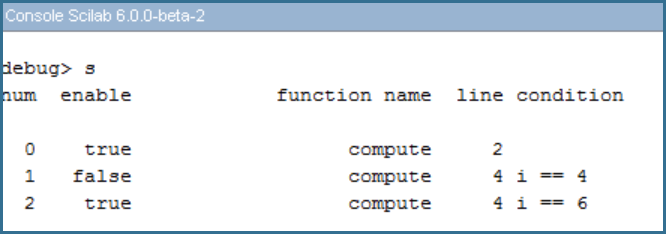
So let’s begin by inserting breakpoints on this code. First use the show (or s) command to see informations (number, enable, function name, line and condition) about your existing breakpoints. As you can see on the image below, we don’t have breakpoints yet.
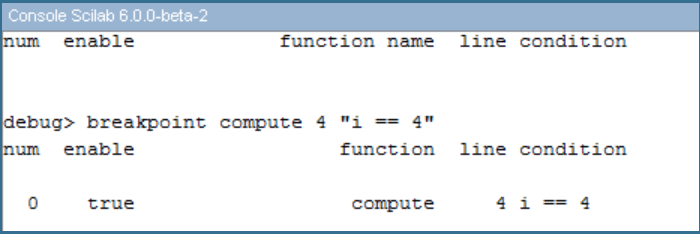
So let’s add one. To do so, you simply have to declare the function and the line you want to break. You can even add a condition. In our example, we may want to stop the for loop of thecompute function at line 4 when the variable i reach the value of 4. We will declare this as follow:
That way, you can define as many breakpoints as you want and disable them by typing disable followed by the number of the breakpoint. In our example, we added 3 breakpoints and enter the line : disable 1. You can now found the enable property of the breakpoint set to false.
Of course you can also enable it or delete it by simply typing enable 1 or delete 1.
Run and analyze your code
You are now ready to analyze your code. Run it with the command exec compute(10)
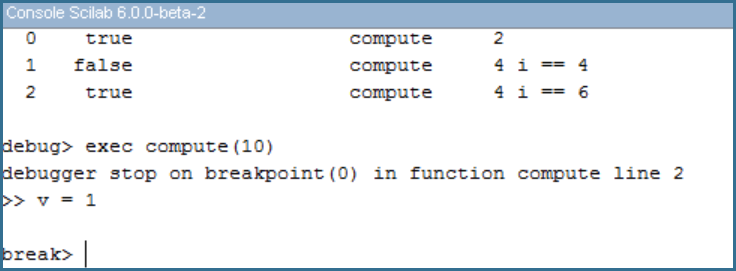
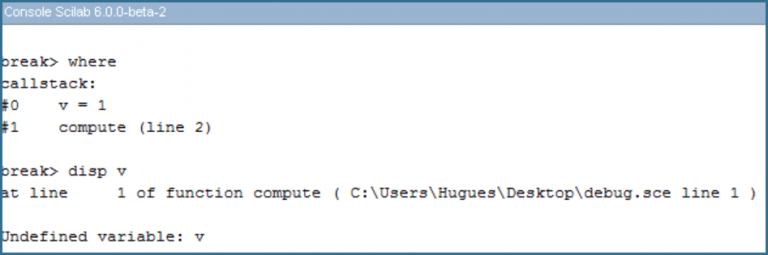
Scilab tells you that you reached the first breakpoint. break > indicates that the execution is now paused. From here you can examinate the callstack with where command line or display variables by typing disp var. In our case, v is not defined before line 2.
After this step, if you have already found your bug, you can stop debugging with the command abort. Otherwise you can continue running your script either line by line with command stepnext (or n) or until the next breakpoint with command continue (or c).
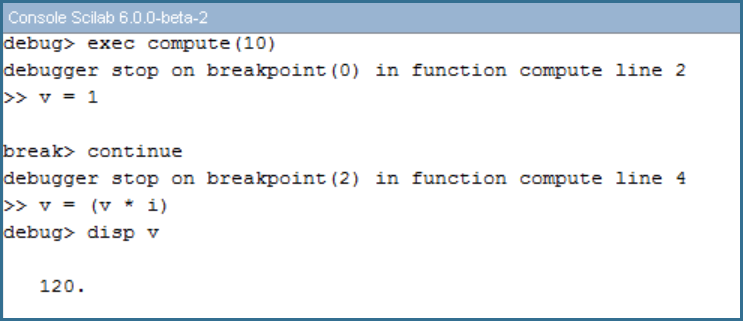
In our example, the script jumped directly to the next enabled breakpoint, breakpoint number 2. Here we can see that variable v reached the value of 120.
Conclusion
You are now able to easily find and correct bug that break your script. For more complex script with multiple functions you can also use the two debugging command line stepin and stepout. Find more informations about them by typing help debug.