Cardiovascular wave analysis module
Challenge
Electrocardiography (ECG) is the process of recording the electrical activity of the heart over a period of time using electrodes placed on a patient’s body. These electrodes detect the tiny electrical changes on the skin that arise from the heart muscle depolarizing during each heartbeat.
This application is performing in 3 operations:
- Data acquisition
- Pre-processing
- Detection and Analysis
Solution
The Scilab module for cardiovascular wave analysis is a collection of more than 90 functions for reading, visualizing and analysis of cardiovascular wave such as multi derivation ECG, blood pressure, breathing…
Data acquisition
Several input data formats, the large files generated by long duration records such as those given by the cardiac holter devices can be managed.
Pre-processing
In addition to the basic Scilab signal processing tools, specific functions are provided for the signal pretreatment like 50Hz removal, ECG baseline wander removal, sub-sampling, etc.
Detection and Analysis
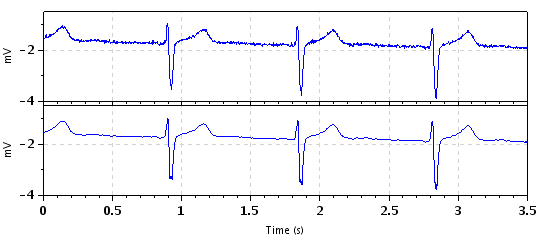
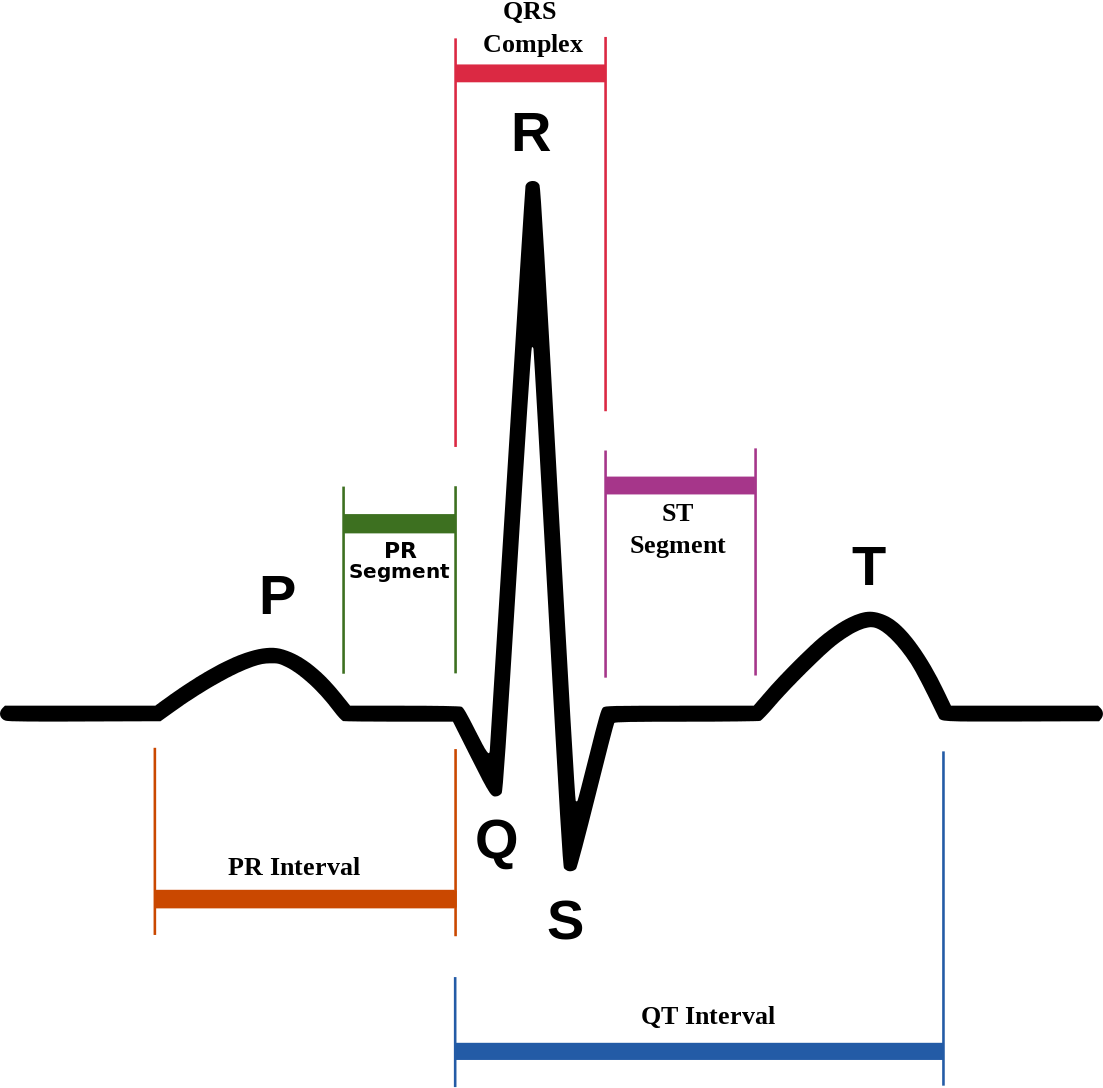
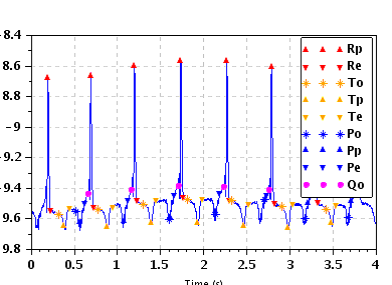
Powerful detection algorithms which allow localization of QRS complex events like the Q, R, S, T peaks, as well as the beginning and the end of the waves are provided. The duration, amplitude, and morphology of the QRS complex are useful for the diagnosis of many cardiac disease states.
Algorithms based on complex demodulation, time frequency analysis or multi-channel non-stationary signal analysis are provided for analysing the behaviour of the baroreflex mechanism from the RR variations with respect to various signals like the systolic or diastolic blood pressure, the tidal volume respiratory. The baroreflex mechanisms driven by the autonomic nervous system provides a rapid feedback loop which aims to regulate the blood pressure.
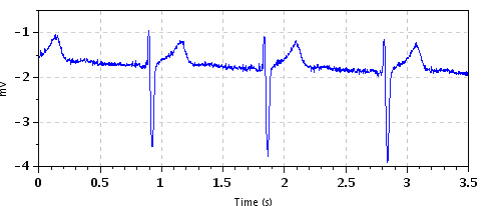
A set of specific functions is provided for the visualization of the ECG and the location of the QRS events with interactive capabilities for long signals.
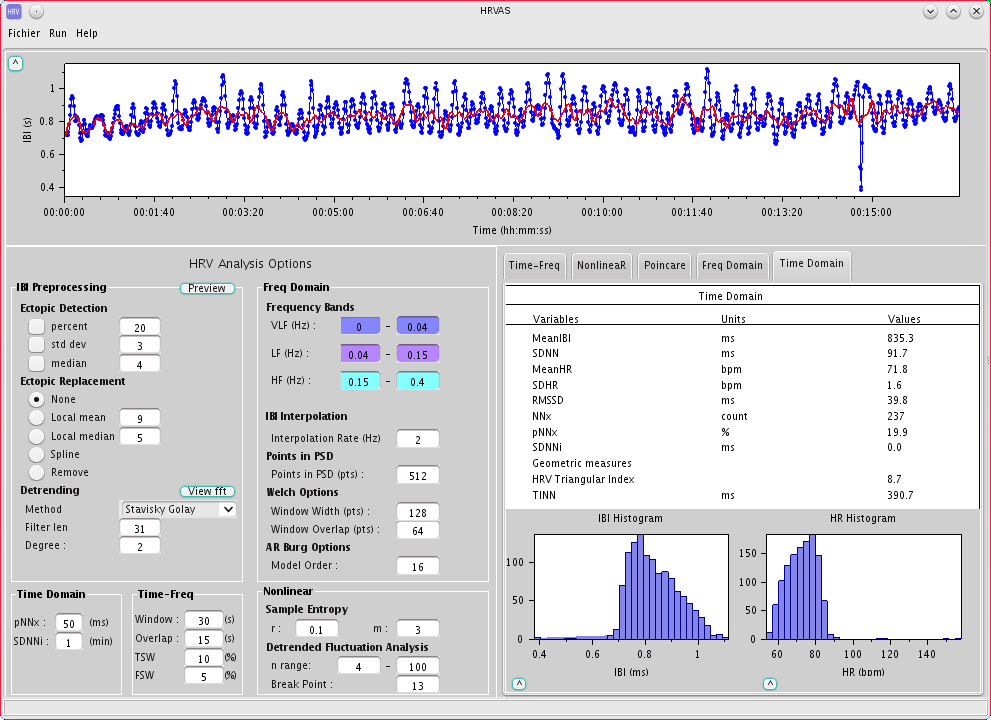
Results